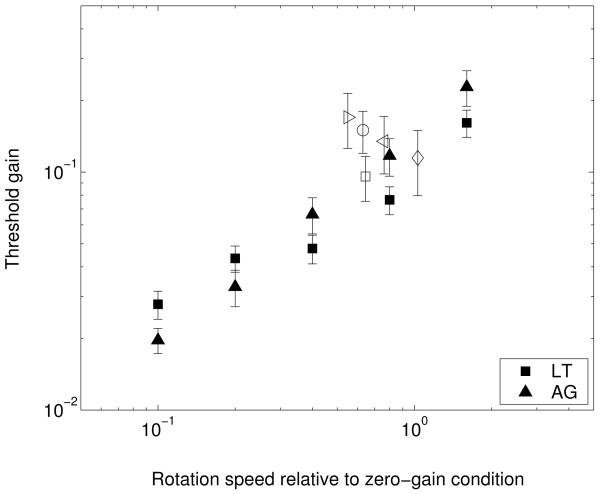
Figure 6. Speed discrimination thresholds.
Results of experiment 1b showing the thresholds for determining whether a ball is rotating faster or slower than the mean speed across trials. Thresholds are given in terms of gain (no units) as in experiment 1a. Thresholds from experiment 1a are re-plotted as open symbols (see text). The abscissa shows rotation speeds in the image, where all rotation speeds are given relative to the situation in which the ball is stationary and the simulated observer moves round it (this corresponds to 1 on the abscissa). A gain of 1 would lead to no image motion and correspond to 0 on this axis. In general, rotation speed is (1 − g), where g is the rotation gain of the ball.

