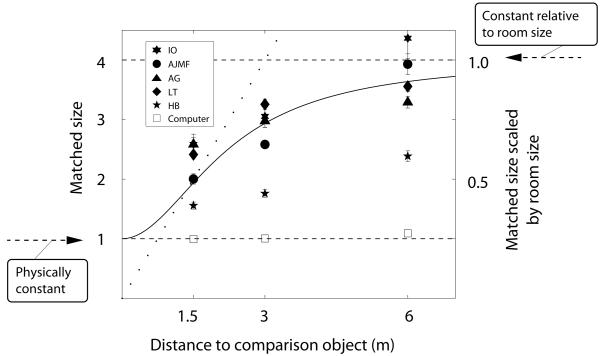
Figure 2. Size matches in the expanding room.
The size of the comparison cube that subjects perceived to be the same size as the standard is plotted against the viewing distance of the comparison cube for five subjects. The standard cube was always presented at 0.75m. The ordinates show matched size relative to the true size of the standard (left) or relative to a cube 4 times the size of the standard (right), i.e. scaled in proportion to the size of the virtual room. Error bars show ±1 s.e.m. The fitted curve shows the output of a model in which cues indicating the true distance of the comparison cube are more reliable, and so have greater weight, at close viewing distances. The dotted line shows the predicted data if subjects matched the retinal size of the standard and comparison cubes. The open squares show the matched size computed from the images a subject saw on a typical trial. We used a 3D reconstruction package, as described in the text and Supplemental Data.

