Figure 5.
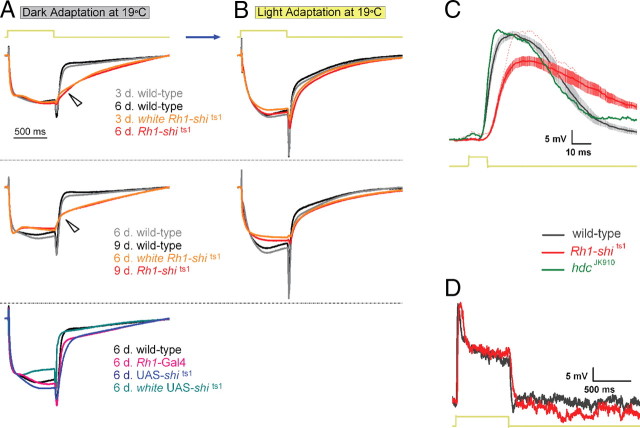
Rh1-shits1 photoreceptors show decelerated voltage responses to light. Mean normalized ERGs (n = 6) to 700 ms stimulus, taken from Figures 1 and 3 after dark adaptation (A) and after light adaptation (B). Wild type is plotted for young (gray) and older (black) flies. white Rh1-shits1 (orange) and Rh1-shits1 (red) at 3 and 6 d posteclosion, respectively, have been plotted together. Similarly, 6 and 9 d posteclosion are shown together. Wild-type (black) and homozygous transgenic controls; Rh1-Gal4 (pink), UAS-shits1 (dark blue) and white UAS-shits1 (blue-green) have been plotted together (bottom). Arrows indicate differences in response waveforms between overexpressed UAS-shits1 and wild type. Age refers to days posteclosion. C, Intracellular recordings of 3 d posteclosion wild-type (black) and Rh1-shits1 (red) photoreceptors. Mean ± SEM shown in traces (n = 9). When Rh1-shits1 displayed the same light response amplitude (red dotted line) as wild type, the dynamics were as slow as the rest of the cells. The histamine mutant hdcJK910 (green) does not show such delay in its response. D, Representative intracellular recordings of wild type (black) and Rh1-shits1 (red) for a 700 ms light stimulus.

