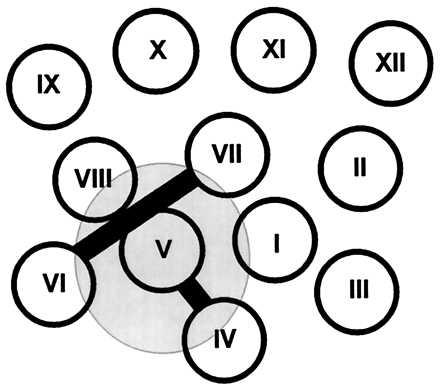
Figure 5.

Helix packing model of lactose permease viewed from cytoplasm showing the possible interaction region with IIAglc. The transmembrane helices are depicted as circles, and the proposed interaction region with IIAglc is shown in gray. Loops IV/V and VI/VII, proposed to be sites of interaction with IIAglc, are represented as solid bars.
