
Figure 2.
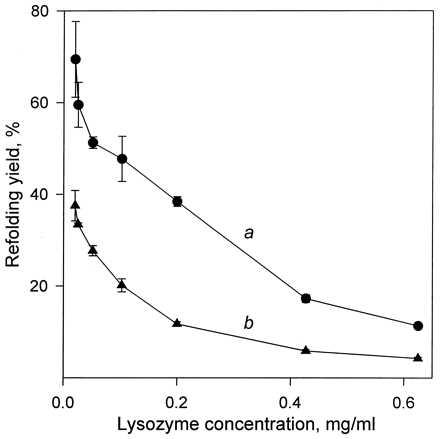
The dependence of the recovery of the lysozyme activity upon refolding/reoxidation on the protein concentration during this reaction in aqueous solution (curve a) and in 99% (vol/vol) glycerol (curve b). For experimental conditions, see Materials and Methods and for those in b also the legend to Table 1. Each data point shown was obtained at least in triplicate, and the mean values were plotted with error bars corresponding to the standard deviations from the mean.