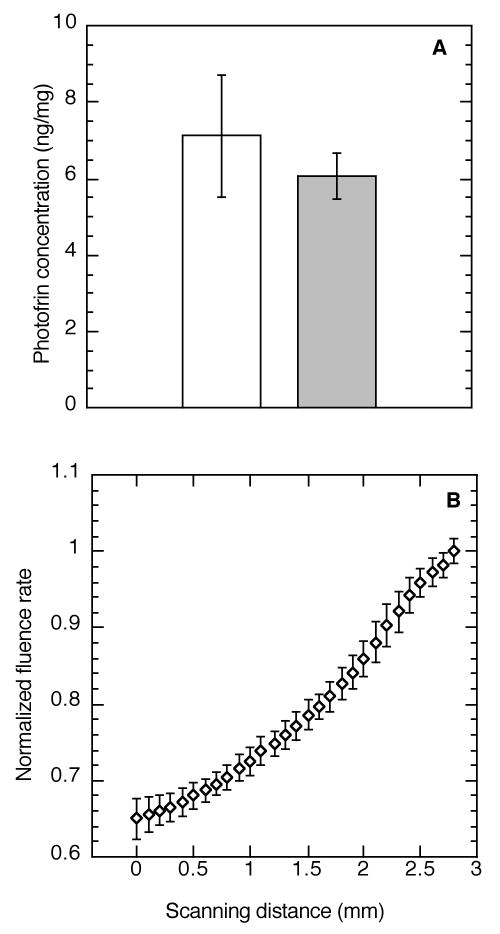
Figure 2.
Depth-dependent regional heterogeneity in tumor Photofrin concentration and light distribution during PDT. Tumor Photofrin concentration (A) was measured by spectrofluorometric assay in regions collected from the tumor surface (open box) or base (shaded box) at 24 h after i.v. administration of 5 mg/kg Photofrin (N = 5 animals); plot shows median ± SE (error bars). Representative plot of light distribution (B) during Photofrin PDT (75 mW/cm2, 135 J/cm2); an isotropic detector was tracked from the base (0 mm) to the surface (3 mm) of a tumor at 45° relative to the incident illumination. Data are normalized to the fluence rate at the tumor surface with points and error bars indicating the mean ± standard deviation of 15 motorized scans throughout the tumor depth over the course of illumination.

