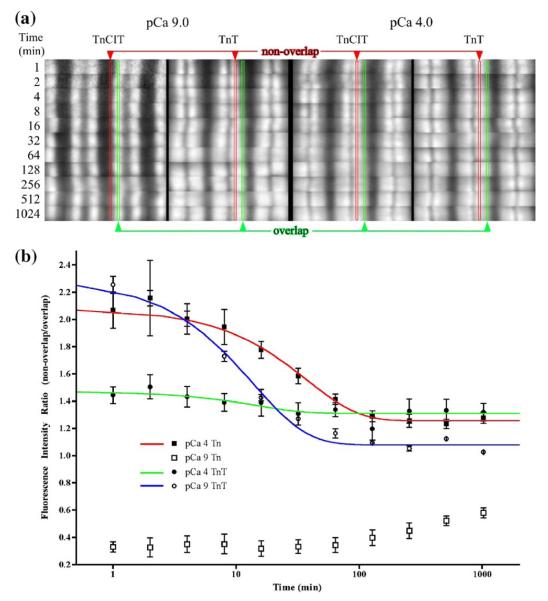
Figure 5.
The rate of Tn dissociation from different states of the thin filament. Troponin T was exchanged for TnCIT as described in Figure 4. Labeled Tn was exchanged into TnCIT and TnT myofibrils as described in Figure 2. Only images from the fluorescence are shown and demonstrate pattern not amount (a). Imaging was done using fixed exposure time (note the noisy signal for the slowest exchanging sample (pCa 9, TnCIT at 1 min). Localization of non-overlap and overlap region is as in Figure 2. The time-dependent change in the pattern is obvious for all myofibrils. Sarcomere intensity increased with time (not shown) while the ratio approached one from either below (pCa 9, TnCIT) or above (pCa 9, TnT; pCa 4, TnCIT and TnT) one. The intensity ratio was fitted to [(1-exp (kno*t))/(1-exp(kol*t))] + C, where kno is the dissociation rate in the non-overlap region; kol is the dissociation rate in the overlap region and C is a constant. Fitted values are given in Table 1.

