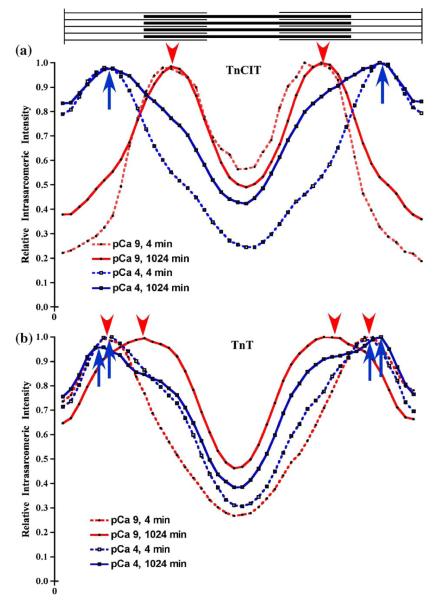
Figure 6.
Intra-sarcomeric relative intensity profiles for TnCIT and TnT myofibrils. The column average (4×44 pixel ROI) was obtained from pCa 9 (red) and 4 (blue), TnCIT (a) and TnT (b) myofibrils at 4 (broken line) and 1024 (continuous line) min from the images in Figure 5(a). For each myofibril, the intensity was normalized to the peak intensity within each sarcomere. Arrowheads mark the intensity peaks for pCa 9 while arrows mark the intensity peaks for pCa 4. For pCa 9, TnCIT myofibrils, there was no change in the position of the peak but there was a change in the intensity in the non-overlap region with increased time. For pCa 4, TnCIT myofibrils, the peak was in the non-overlap region at both 4 and 1024 min and there was an increase in the intensity in the overlap region with increased time. With TnT myofibrils, there was a change in the position of the peak with increased time. At pCa 9, the peak moved from the non-overlap to the A-I band junction while at pCa 4, it moved from the middle of the non-overlap region to nearer the Z-line.

