
Figure 2.
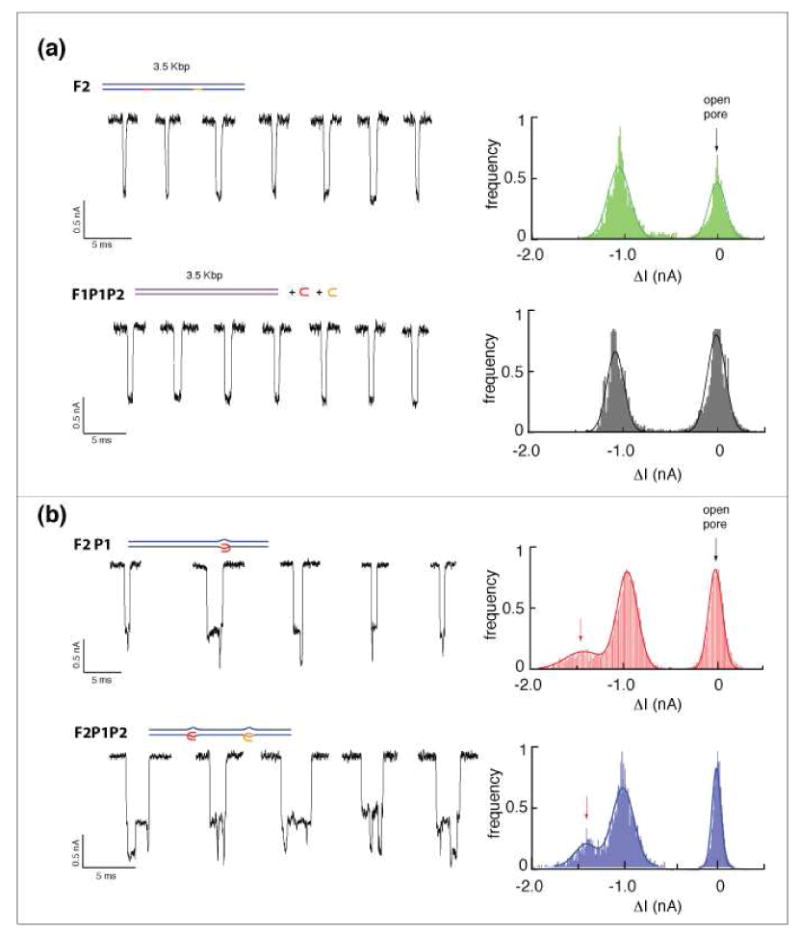
Representative ion current traces of F1 and F2 translocation through a ∼4.5 nm pore (low-pass filtered for better presentation). (a) Control measurements, using the lone F2 and F1 hybridized with both P1 and P2, are nearly identical showing a single blocked level with δI ≈ 1 nA. (b) Signals from F2 molecules hybridized with either one or both of the PNA probes display two distinct current levels, with δI ≈ 1 nA and 1.4 nA, Signals were digitally filtered at 20 kHz for display purpose.