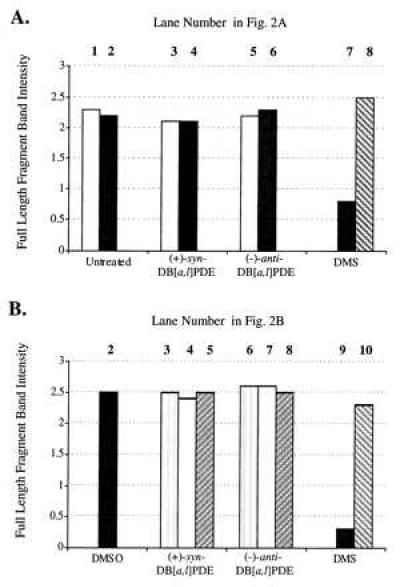
Figure 3.

Intensity of the 14-kb band of the DHFR gene of the DNA samples shown in Fig. 2. All band intensities were normalized for the efficiency of sample loading on the gel through the use of a plasmid loading control. (A) DNA that had reacted with DB[a,l]PDE in solution. (B) DNA from cells treated with DB[a,l]PDE. The lane numbers corresponding to the sample in Fig. 2 are indicated above each sample.
