
Figure 1.
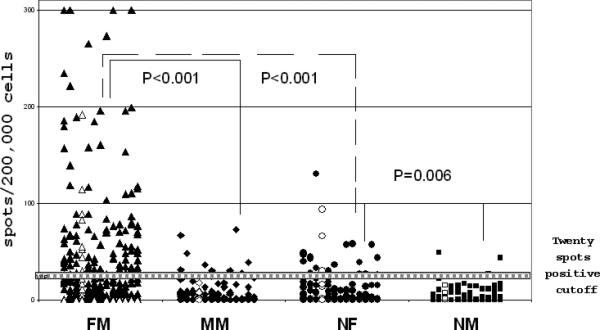
T cell responses to 13 immunogenic HY peptides in FM patients, MM patients, normal females (NF) and normal males (NM).
13 HY peptides are listed in the same order on the X axis in patient and control groups. The Y axis represents the number of spots/200,000 cells in ELISPOT assay for each peptide after subtraction of values for negative control peptides (HIV or HCV). Values >20 spots/200,000 cells are considered positive. Open symbols represent the previously known HLA A*0201 restricted HY.