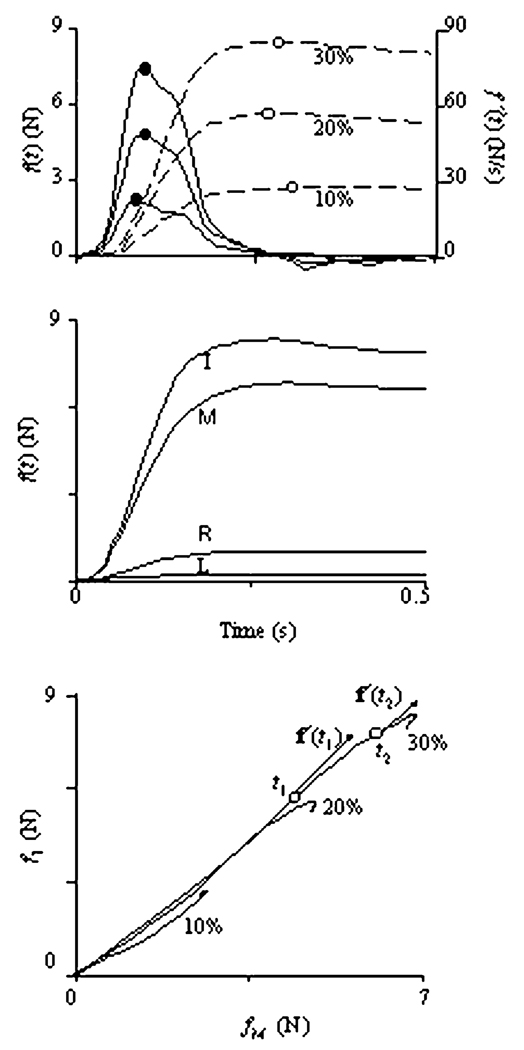
Fig. 1.
A–C A Force f(t) (dashed lines) and force rate f′(t) (solid lines) time profiles during single-finger tasks performed by the index finger. The curves show averages over 12 trials performed by a representative subject. Target force levels were 10%, 20%, and 30% of the MVC. Empty circles and filled circles correspond to peaks of force and force rate, respectively. B Time profiles of the master (I and M) and slave (R and L) finger forces in a two-finger task (IM) at 30% of MVC. C. Force–force trajectories for a two-finger task (IM) at three target force levels. The directions of the force rate vectors f′(t1) and f′(t2) are shown for two arbitrarily selected times, t1 and t2

