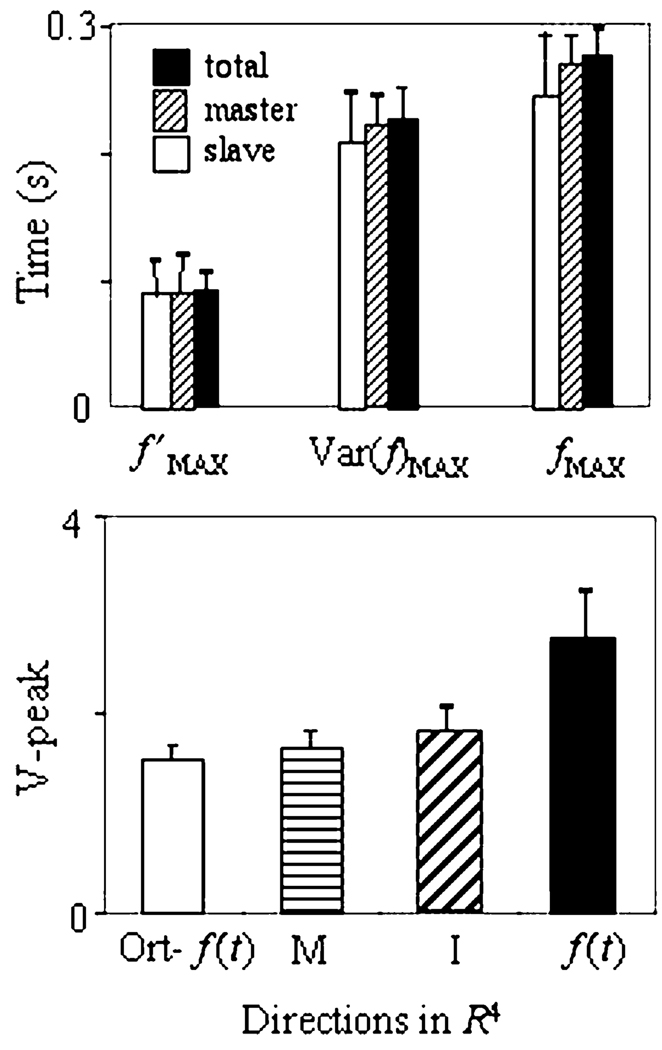
Fig. 3.
Upper panel: Mean values of the times of the maxima of the force rate, force variance, and force are shown separately for force time profiles of the master fingers, slave fingers, and all the fingers (with standard error bars). Note that the peaks of variance (V-peak) occurred between the peaks of force rate and force. Lower panel: Relative magnitude of the V-peak (Eq. 3) and its 95% confidence interval (bars) for different directions in the finger force space R4 (I—index finger force, M—middle finger force, f′(t)—force rate, and ORT-f′(t)—directions orthogonal to f′(t)). V-peak is maximum in the direction of f′(t), and minimum in directions orthogonal to f′(t)

