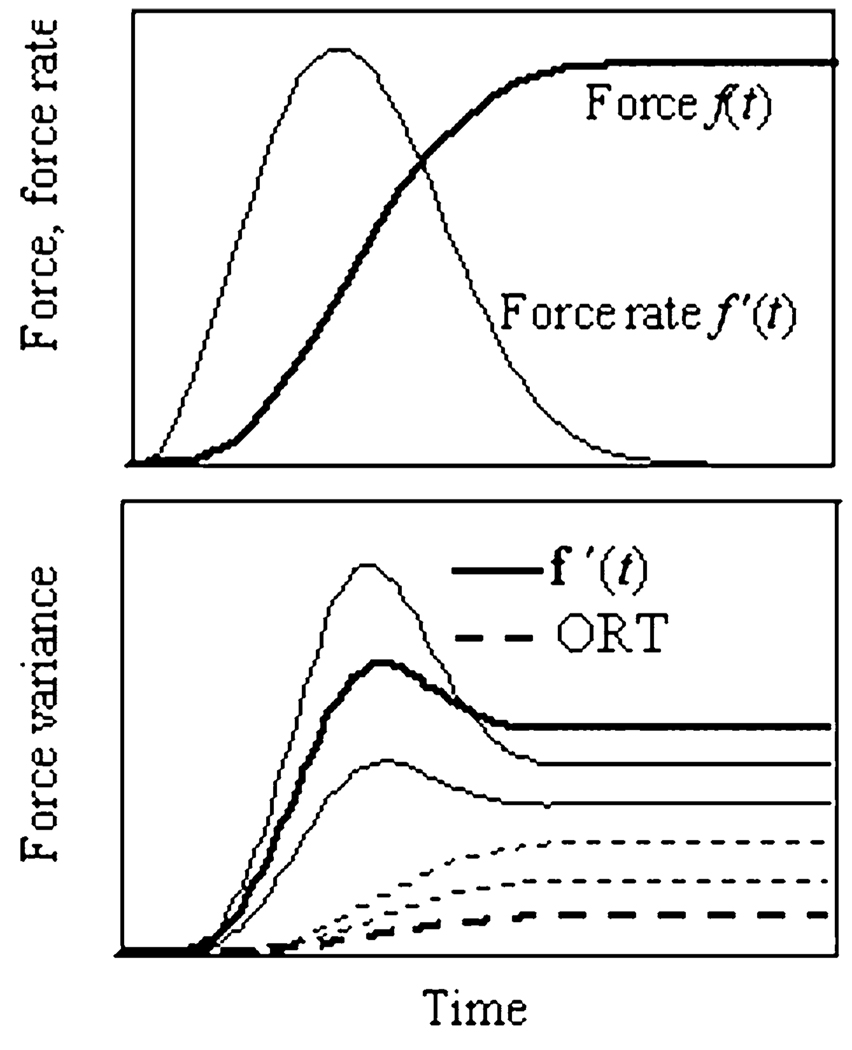
Fig. 6.
Upper panel: Force (thick line) and force rate (thin line) during a force pulse with a sigmoid time profile, f(t)=b(1− exp (−(t/τ)2.5)). Lower panel: Typical force variance time profiles, parameterized by values of {xnm} and {ynm}. Solid lines: variance in the direction of the force rate; dashed lines: variance in direction orthogonal to the force rate. Y-axes are dimensionless

