Abstract
Diagonal capillary electrophoresis is a form of two-dimensional capillary electrophoresis that employs identical separation modes in each dimension. The distal end of the first capillary incorporates an enzyme-based microreactor. Analytes that are not modified by the reactor will have identical migration times in the two capillaries and will generate spots that fall on the diagonal in a reconstructed two-dimensional electropherogram. Analytes that undergo enzymatic modification in the reactor will have a different migration time in the second capillary and will generate spots that fall off the diagonal in the electropherogram. We demonstrate the system with immobilized alkaline phosphatase to monitor the phosphorylation status of a mixture of peptides. This enzyme-based diagonal capillary electrophoresis assay appears to be generalizable; any post-translational modification can be detected as long as an immobilized enzyme is available that reacts with the modification under electrophoretic conditions.
Introduction
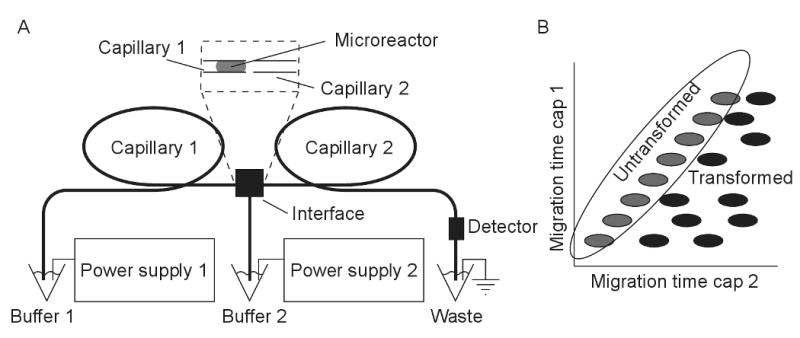
Over the past twenty-five years, a number of two-dimensional separation methods have been developed to screen for specific functional groups in complex mixtures of analyte.1-10 These methods employ identical separation modes in both dimensions. In the absence of treatment of the sample between separation dimensions, any analyte will have identical mobilities in the two capillaries, and all analyte will fall on the diagonal in a plot of the separation time in the first dimension vs. separation time in the second dimension. If the analyte undergoes a reaction between the separation modes, then the analyte will have a change in its migration time in the second dimension, and it will fall off the diagonal.
The earliest examples employed paper chromatography to characterize disulfide bonds in peptides.1-2 The mixture was separated on a paper strip, treated to break disulfide bonds, and then subjected to a second dimension separation. Peptides that were unaffected by the treatment had identical retention in the two dimensions and fell along a diagonal line in the two-dimensional chromatogram. Those peptides whose disulfide bonds were disrupted fell off the diagonal.
Vandekerckhove extended the technology to diagonal liquid chromatography.3 In a typical example, tryptic digests are first separated by HPLC. Several dozen fractions are collected. Each fraction is dried, resuspended, treated to modify a residue or posttranslational modification, and subjected to a second dimension separation. Gradient-elution is employed in both dimensions, and reconditioning of the column after each separation adds significantly to the analysis time. To speed the analysis, four widely spaced first dimension fractions were pooled before the second dimension separation; this method is called combined fractional diagonal chromatography (COFRADIC). The technology has been expanded to the study of phosphorylation, N-glycosylation, and N-terminal acetylation through selective chemical or enzymatic transformation between separation dimensions.3-8
Nikolaev reported an analogous two-dimensional gel electrophoresis system for transcription factor mapping.9-10 A radiolabeled restriction digest was mixed with a transcription factor and separated in a 1-mm wide electrophoresis gel. The gel was then placed upon a second gel, whose width matched the length of the first strip. The second gel had identical composition as the first except for the addition of 0.1% SDS. Electrophoresis was then performed at right angles to the strip. The SDS denatured the transcription factor, releasing bound oligonucleotides. The two-dimensional electropherogram consisted of a set of spots along the diagonal from restriction fragments that did not bind to the protein and a set of off-diagonal components that had been bound to the protein.
In all forms of diagonal chromatography of which we are aware, the sample is manipulated between separation dimensions. While these manipulations can be performed by robotic fluid manipulations, they can be quite extensive and require significant time.
In this paper, we report the first example of a diagonal separation that incorporates an online microreactor to eliminate sample handling between dimensions. We also report the first example of diagonal capillary electrophoresis, which provides much faster separations than gradient elution HPLC. In this proof-of-principle experiment applied to phosphopeptides, a microreactor containing immobilized alkaline phosphatase is placed at the distal end of the first capillary. This reactor automatically removes phosphate groups from a fraction during the separation time of the preceding fraction. Unphosphorylated peptides fall on the diagonal of the reconstructed electropherogram while peptides that underwent dephosphorylation fall off the diagonal.
This is not the first report of the use of immobilized enzymes in capillary electrophoresis. Amankwa coupled capillary electrophoresis with a microreactor containing immobilized alkaline phosphatase for phosphorylation analysis.11 That system employed a one-dimensional separation, and subtractive analysis was required to identify the dephosphorylated peptides. Other systems have employed magnetic beads for enzyme immobilization.12-14 Magnetic beads offer great flexibility in regeneration of the reactor; high pressure is used to flush the beads to waste, and a new plug of beads is injected to create a new reactor.
Experimental section
Electrophoresis system
A locally constructed capillary electrophoresis instrument was employed in these experiments.15 The instrument was coupled with a post-column sheath-flow cuvette fluorescence detector that has been described in detail elsewhere.16-17 Fluorescence was excited with a 10 mW solid-state laser operating at 473 nm. Emission was collected at right angles with a 0.65 NA microscope objective, filtered with a 580 nm long pass filter, and imaged onto a GRIN-lens coupled fiber optic, which was coupled to a single photon counting avalanche photodiode. The signal was recorded at 30 Hz, corrected for detector nonlinearity,18-19 passed through a 3-point median filter to remove noise spikes, and smoothed with a 0.5-s Gaussian filter before plotting.
One-dimensional separations were performed using 50-μM ID, 150-μm OD, and 50 cm long capillaries. Capillaries were coated with UltraTrol LN (Target Discovery). Peptide separations were performed by applying -20 kV at the injection end of the capillary; the detector was always held at ground potential. The separation buffer was 10 mM ammonium bicarbonate, pH 8.
The diagonal capillary electrophoresis system was modeled on a two-dimensional capillary electrophoresis system developed in this laboratory.20 The instrument employed two 50-μm ID, 150-μm OD, 25-cm long capillaries, figure 1. As in the one-dimensional separations, UltraTrol LN was used as a dynamic coating and the separation buffer was 10 mM ammonium bicarbonate pH 8. A liquid junction interface connected the two capillaries, which were spaced about 50 microns apart. For this study, a previously described interface was modified by incorporation of triangular permanent magnets (Engineered Concepts) positioned near the outlet of the first capillary.21-22
Figure 1.

Enzyme-based diagonal capillary electrophoresis system. (A) Two-dimensional capillary electrophoresis with identical separation modes employs a microreactor at the distal end of the first capillary. (B) Components that undergo transformation in the reactor fall off the diagonal in the reconstructed two-dimensional electropherogram.
Alkaline phosphatase reactor
Calf intestinal alkaline phosphatase (Sigma Aldrich) was covalently immobilized on superparamagnetic microspheres via carbodiimide chemistry. Beads used for the project were purchased from Invitrogen (Dynabeads) or Bangs Labs (Biomag). The beads were 2.8 μm and 1 μm in diameter, respectively, and were functionalized with carboxylate groups. In a typical immobilization procedure, 2 milligrams of beads were activated with equal volumes of 50 mg/mL solution of N-ethyl-N′-(3-dimethylaminopropyl) carbodiimide) and N-hydroxysulfo succinimide for 30 minutes. After activation, the beads were washed and incubated in a 1 mg/mL solution of alkaline phosphatase for 30 minutes. 25 mM MES pH 6 was used as a washing, activation and coupling buffer. After enzyme immobilization, the beads were washed and their unreacted sites were blocked with 50 mM Tris, pH 7.8. Beads were stored in 20 mM Tris, pH 7.8 buffer at 4 °C and washed with running buffer before use.
A BCA protein assay kit (Thermo-Pierce) was used to estimate the amount of enzyme immobilized to beads. The BCA results indicated 5 micrograms of enzyme coupled to 1 milligram of beads.
For experiments involving the microreactor, magnetic beads were injected by pressure (usually 1 psi for 1 min) into the first capillary. The beads were retained by the magnets in the form of a plug, 1- to 3-mm in length. The beads were flushed from the capillary with high pressure and replaced with a fresh batch before each experiment.
Samples
Two samples were employed in this experiment. The first was a commercially available monophosphopeptide standard derived from beta-casein (Sigma-Aldrich P9615 - Phe-Gln-pSer-Glu-Glu-Gln-Gln-Gln-Thr-Glu-Asp-Glu-Leu-Gln-Asp-Lys). Most fluorescent labels convert cationic lysine residues into neutral or anionic derivatives, which produce complex electropherograms.23 We instead employed PY 503 dye (Active Motif). This reagent converts cationic lysine residues into cationic reaction products, thus preserving the charge on the labeled peptide; labeled peptides and proteins generate quite sharp peaks during capillary electrophoresis.24 A 25 μM phosphopeptide solution was fluorescently labeled with 50 μM of the PY 503 dye. Labeling was performed in a 10 mM sodium bicarbonate, pH 9, buffer at 37 °C for 30 minutes. For analysis of this sample, transfers between dimensions were performed for 1 second with -20 kV applied to the injection end of the first capillary and -10 kV at the interface between the capillaries; the detector was held at ground potential. Each cycle of the 2nd dimension separation was 45 seconds in duration and was driven by applying -10 kV to both the injection end of the first capillary and the interface.
The second sample was the tryptic digest of α-casein. The digest was prepared as follows: 5 mg/mL α-casein in 25 mM ammonium bicarbonate was mixed with TCPK-treated trypsin in a 1:50 enzyme-to-protein ratio. Digestion was performed overnight at 37 °C. Digest aliquots were frozen at -70 °C. The thawed digest was fluorescently labeled by mixing equal amounts of 1 mg/mL digest (44 μM) and 1 mM PY 503 dye dissolved in methanol; the mixture was incubated at 40 °C for 30 minutes. For analysis of this sample, transfers between dimensions were performed for 2 seconds with -15 kV applied to the injection end of the first capillary and -10 kV at the interface between the capillaries; the detector was held at ground potential. Each cycle of the 2nd dimension separation was 45 seconds in duration and was driven by applying -10 kV to both the injection end of the first capillary and the interface.
Results and discussion
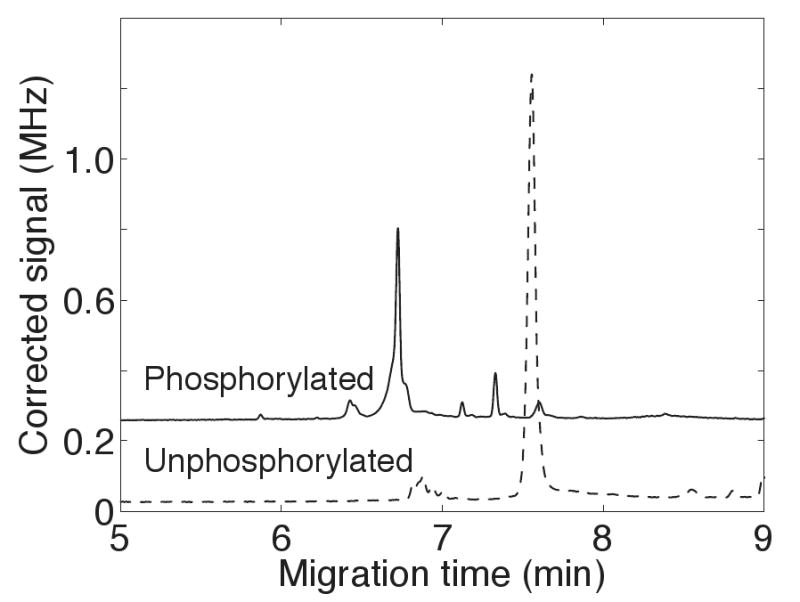
Figure 2 presents the one-dimensional electropherogram of a phosphopeptide standard and its unphosphorylated form. There was a significant difference in mobility for the two forms of the peptide, reflecting the difference in their charge, which produced a 1-minute shift in migration time. Capillary electrophoresis is particularly useful in monitoring changes in the phosphorylation status of a molecule.
Figure 2.

One-dimensional electrophoresis analysis of a PY 503-labeled phosphorylated peptide (Phe-Gln-pSer-Glu-Glu-Gln-Gln-Gln-Thr-Glu-Asp-Glu-Leu-Gln-Asp-Lys) and its unphosphorylated counterpart.
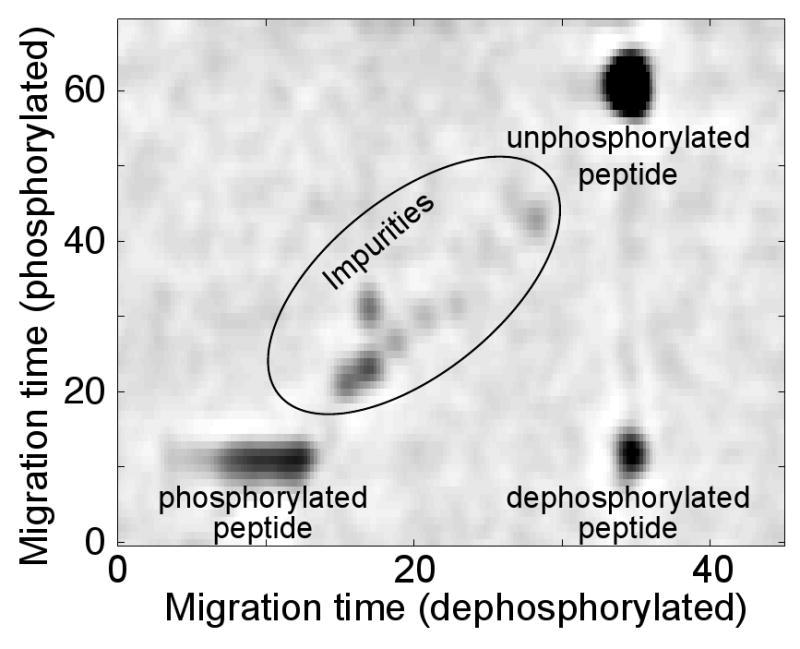
A mixture of the phosphorylated and unphosphorylated peptide was analyzed with the enzyme-based diagonal capillary electrophoresis system, Figure 3. A relatively low activity reactor was employed that did not allow for complete dephosphorylation of the peptides during the 45-s residence time.
Figure 3.

Differential mobility assay of a mixture of phosphorylated and unphosphorylated forms of the same peptide with a low-activity reactor. Time is in units of fractions transferred in the phosphorylated axis and in seconds in the dephosphorylated axis. The image was overexposed to highlight the lower abundance impurities. The zero migration times are arbitrary. Dynabeads were used in this reactor.
The reconstructed two-dimensional electropherogram shows a set of spots on the diagonal plus one off-diagonal component. That spot is generated by phosphopeptide that underwent dephosphorylation in the reactor. That spot has identical mobility with the phosphorylated peptide in the first dimension because it is derived from that peptide. It has identical mobility in the second dimension as the unphosphorylated peptide because it is identical to that peptide after it leaves the reactor.
A very faint trace is observed between the dephosphorylated and unphosphorylated peptides. That trace is likely caused by a very small amount of dephosphorylated peptide leaching from the reactor.
The 46-s separation time is much shorter than the time necessary for the peptides to migrate through the second capillary. As a result, more than one fraction is present simultaneously in the second capillary. However, as long as the fastest moving component does not overtake the slowest moving component in the preceding fraction, the resulting electropherogram can be interpreted without ambiguity. By matching the second dimension separation time to the separation window of a one-dimensional separation, we dramatically speed the two-dimensional separation.
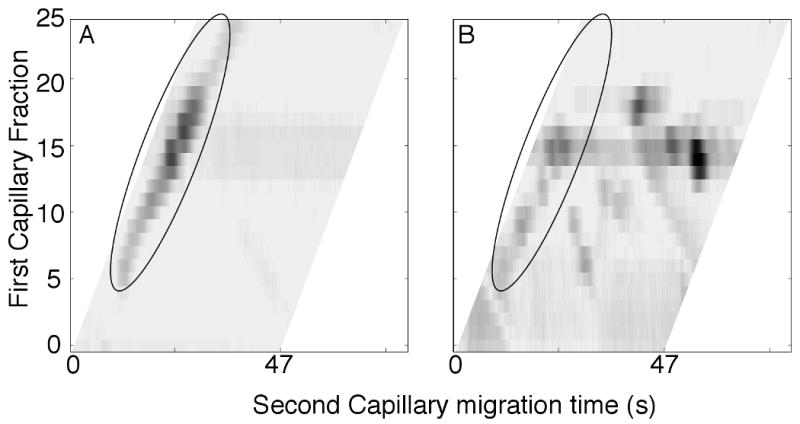
Figure 4 presents the enzyme-based diagonal capillary electrophoresis analysis of a more complex sample, the tryptic digest of α-casein. In the absence of a reactor, the two-dimensional electropherogram consists of a single trace along the diagonal. In the presence of the reactor, a number of components have moved off the diagonal, indicating that dephosphorylation has occurred. In this experiment, the reactor had high activity and appears to have efficiently dephosphorylated peptides. Few, if any, peptides show both phosphorylated and dephosphorylated forms. We conclude that the remaining components on the diagonal were not phosphorylated in the protein.
Figure 4.

Differential mobility assay of the tryptic digest of a-casein with high-activity reactor. The components migrating along the diagonal are circled. Biomag beads were used in this reactor. A.- no reactor. B – with reactor.
The images of figure 4 are skewed. We carefully matched the migration time in the second dimension to the 47-s wide separation window for the components. Fast moving components from one fraction approach the slowest moving components of the preceding fraction. By skewing the plot, we show the entire separation without the distraction of components wrapping around to appear on the opposite side of the electropherogram.
Several peptides in the digest contained multiple phosphorylation sites. Those peptides appear to have been completely dephosphorylated in the reactor. Partially dephosphorylated peptides would be created from the same first capillary fraction and would generate a set of horizontal spots. Those spots are not observed, again suggesting that this high-efficiency reactor completely dephosphorylated the peptides.
The data of Fig 4 A demonstrate that the two separations are indeed identical. We identified a set of eight reasonably well-resolved spots in this figure and used a nonlinear regression to fit a Gaussian surface to each spot. The migration time in the two dimensions was highly correlated (r =0.9997).
Conclusion
Unlike other forms of diagonal separations, enzyme-based diagonal capillary electrophoresis requires no sample manipulations beyond loading the sample into the first dimension capillary. No strip manipulations, pipetting, or fraction collection steps are required, and the reaction occurs on-line, eliminating environmental contamination. In contrast, other forms of diagonal separations often require significant manipulation of the sample. As an extreme example, the original description of COFRADIC required collection of 144 fractions and at least 200 pipetting steps.3
Acknowledgments
We gratefully acknowledge support from the National Institutes of Health (R33CA122900) and the Center for Process Analytical Chemistry.
Literature cited
- 1.Brown JR, Hartley BS. Biochem J. 1963;89:59–60. [Google Scholar]
- 2.Brown JR, Hartley BS. Biochem J. 1966;101:214–228. doi: 10.1042/bj1010214. [DOI] [PMC free article] [PubMed] [Google Scholar]
- 3.Gevaert K, Van Damme J, Goethals M, Thomas GR, Hoorelbeke B, Demol H, Martens L, Puype M, Staes A, Vandekerckhove J. Mol Cell Proteomics. 2002;1:896–903. doi: 10.1074/mcp.m200061-mcp200. [DOI] [PubMed] [Google Scholar]
- 4.Liu PR, Feasley CL, Regnier FE. J Chromatogr A. 2004;1047:221–227. doi: 10.1016/j.chroma.2004.06.126. [DOI] [PubMed] [Google Scholar]
- 5.Vande Walle L, Van Damme P, Lamkanfi M, Saelens X, Vandekerckhove J, Gevaert K, Vandenabeele P. J Proteome Res. 2007;6:1006–1015. doi: 10.1021/pr060510d. [DOI] [PubMed] [Google Scholar]
- 6.Gevaert K, Van Damme P, Ghesquière B, Vandekerckhove J. Biochim Biophys Acta. 2007;1764:1801–1810. doi: 10.1016/j.bbapap.2006.09.003. [DOI] [PubMed] [Google Scholar]
- 7.Ghesquière B, Buyl L, Demol H, Van Damme J, Staes A, Timmerman E, Vandekerckhove J, Gevaert K. J Proteome Res. 2007;6:4304–4312. doi: 10.1021/pr0703728. [DOI] [PubMed] [Google Scholar]
- 8.Gevaert K, Vandekerckhove J. Methods Mol Biol. 2009;527:219–227. doi: 10.1007/978-1-60327-834-8_16. [DOI] [PubMed] [Google Scholar]
- 9.Chernov IP, Timchenko KA, Akopov SB, Nikolaev LG, Sverdlov ED. Anal Biochem. 2007;364:60–66. doi: 10.1016/j.ab.2007.01.040. [DOI] [PubMed] [Google Scholar]
- 10.Chernov IP, Akopov SB, Nikolaev LG, Sverdlov ED. Biotechniques. 2006;41:91–96. [PubMed] [Google Scholar]
- 11.Amankwa LN, Harder K, Jirik F, Aebersold R. Protein Sci. 1995;4:113–125. doi: 10.1002/pro.5560040114. [DOI] [PMC free article] [PubMed] [Google Scholar]
- 12.Logan TC, Clark DS, Stachowiak TB, Svec F, Fréchet JM. Anal Chem. 2007;79:6592–6598. doi: 10.1021/ac070705k. [DOI] [PubMed] [Google Scholar]
- 13.Rashkovetsky LG, Lyubarskaya YV, Foret F, Hughes DE, Karger BL. J Chromatogr A. 1997;781:197–204. doi: 10.1016/s0021-9673(97)00629-8. [DOI] [PubMed] [Google Scholar]
- 14.Le Nel A, Krenkova J, Kleparnik K, Smadja C, Taverna M, Viovy JL, Foret F. Electrophoresis. 2008;29:4944–4947. doi: 10.1002/elps.200800431. [DOI] [PubMed] [Google Scholar]
- 15.Kraly JR, Jones MR, Gomez DG, Dickerson JA, Harwood MM, Eggertson M, Paulson TG, Sanchez CA, Odze R, Feng Z, Reid BJ, Dovichi NJ. Anal Chem. 2006;78:5977–5986. doi: 10.1021/ac061029+. [DOI] [PMC free article] [PubMed] [Google Scholar]
- 16.Cheng YF, Dovichi NJ. Science. 1988;242:562–564. doi: 10.1126/science.3140381. [DOI] [PubMed] [Google Scholar]
- 17.Wu SL, Dovichi NJ. J Chromatogr. 1989;480:141–155. doi: 10.1016/s0021-9673(01)84284-9. [DOI] [PubMed] [Google Scholar]
- 18.Turner EH, Lauterbach K, Pugsley HR, Palmer VR, Dovichi NJ. Anal Chem. 2007;79:778–781. doi: 10.1021/ac061778r. [DOI] [PubMed] [Google Scholar]
- 19.Whitmore CD, Essaka D, Dovichi NJ. Talanta. 2009;80:744–748. doi: 10.1016/j.talanta.2009.07.060. [DOI] [PMC free article] [PubMed] [Google Scholar]
- 20.Michels DA, Hu S, Schoenherr RM, Eggertson MJ, Dovichi NJ. Mol Cell Proteomics. 2002;1:69–74. doi: 10.1074/mcp.t100009-mcp200. [DOI] [PubMed] [Google Scholar]
- 21.Ye M, Hu S, Schoenherr RM, Dovichi NJ. Electrophoresis. 2004;25:1319–1326. doi: 10.1002/elps.200305841. [DOI] [PubMed] [Google Scholar]
- 22.Schoenherr RM, Ye M, Vannatta M, Dovichi NJ. Anal Chem. 2007;79:2230–2238. doi: 10.1021/ac061638h. [DOI] [PMC free article] [PubMed] [Google Scholar]
- 23.Zhao JY, Waldron KC, Miller J, Zhang JZ, Harke H, Dovichi NJ. J Chromatogr. 1992;608:239–242. doi: 10.1016/0021-9673(92)87129-v. [DOI] [PubMed] [Google Scholar]
- 24.Turner EH, Dickerson JA, Ramsay LM, Swearingen KE, Wojcik R, Dovichi NJ. J Chromatogr A. 2008;1194:253–256. doi: 10.1016/j.chroma.2008.04.046. [DOI] [PMC free article] [PubMed] [Google Scholar]


