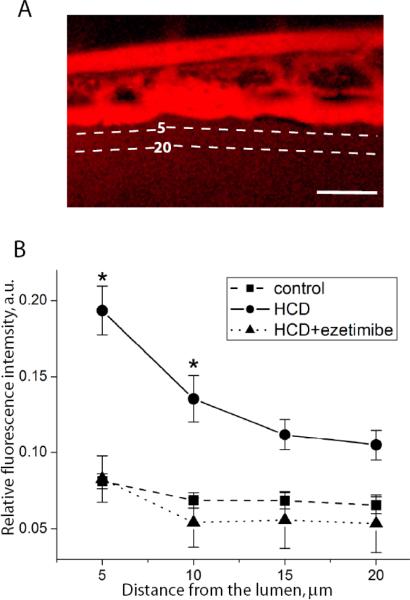
Figure 6. HCD-induced increase in endothelial layer permeability.
Experimental conditions as in Fig. 5B, but no fluorescent lipid was added to the diet. Leakage of i.v. injected red fluorescent dextran (2×10⁶Da) from the caudal vein was measured as described in Methods. Dashed lines at 5 and 20 μm from the lumen show where the fluorescence intensities were measured. Scale, 50 μm. *, p<0.01 (n=9–11 animals per group).

