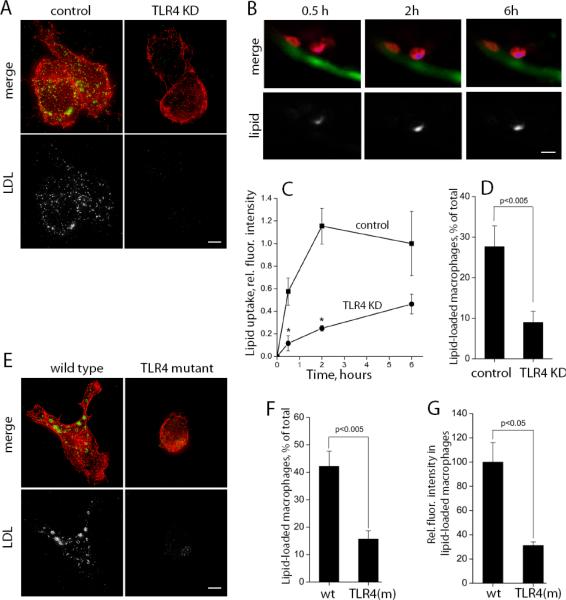
Figure 8. TLR4-dependent lipid uptake.
A, In a cell culture experiment, the uptake of Alexa Fluor 488-labeled native LDL (150 μg/ml) was stimulated by non-labeled mmLDL (50 μg/ml) for 1 hour. J774 macrophages were expressing scrambled shRNA (control) or TLR4-specific shRNA (TLR4 KD). Red, F-actin; green, Alexa488-LDL. The fluorescence from labeled LDL is shown in white in lower panels. Scale, 5 μm. B, CellTracker Orange-labeled control J774 macrophages were transplanted into fli1:EGFP larvae that, prior to the transplantation, was fed for 10 days a HCD supplemented with red fluorescent lipid. Repetitive images of the same cells in live fish were captured (red, macrophages; blue and white, fluorescent lipid; green, EC). Scale, 10 μm. C, From the data collected in experiments in panel B, the time courses of lipid uptake by individual transplanted macrophages were measured for control and TLR4 KD J774 cells (n=25–30 cells for each time point; total of 10 animals imaged). *, p<0.01. D, In a separate set of experiments, the percentage of transplanted macrophages that accumulated fluorescent lipid 24 hours post injection into HCD-fed larvae was determined (n=9). E, In a cell culture experiment, the uptake of Alexa Fluor 488-labeled native LDL (150 μg/ml) was stimulated by non-labeled mmLDL (50 μg/ml) for 1 hour in wild type and TLR4-mutant primary macrophages harvested from C3H mice. Red, F-actin; green and white, Alexa488-LDL. Scale, 5 μm. F, In a zebrafish transplant experiment, performed as in panel B, a percentage of transplanted primary macrophages that accumulated lipid 2 hours post injection into HCD-fed larvae was determined for wild type and TLR4-mutant primary macrophages (n=5 animals per group; total of 234 wild type and 125 TLR4-mutant cells were counted). G, Integrated intensities of intracellular fluorescent lipid in only those transplanted primary macrophages that were counted in panel F (n=26 for wild type and n=11 for TLR4-mutant cells; not all positive cells were suitable for quantification due to their position or image quality).

