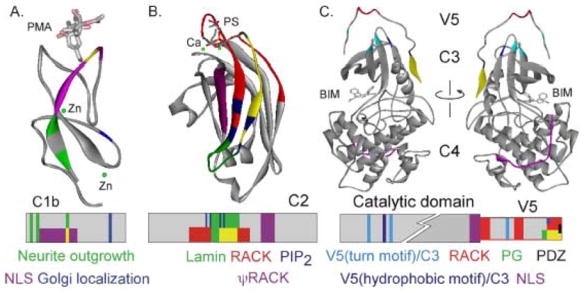
Figure 3. PKC inter- and intra- molecular interaction sites mapped on individual PKC domains.

A. Interactions are mapped on the δC1b domain (adapted from 1PTQ (93)) crystallized with PMA (stick figure) and zinc (green). Regions responsible for neurite outgrowth are indicated in green (42), nuclear localization sequence in purple (43), and golgi localization signal (94) in blue. Intersection of green and purple region is indicated in yellow. Lower panel shows the schematic of the domain with color-coded interaction regions. B. Interactions are mapped on the αC2 domain (adapted from 1DSY (95)) crystallized with phosphatidylserine (stick figure) and calcium (green). Regions responsible for RACK binding (red (60)), PIP2 binding (dark blue (50)), lamin binding (green (92)) and the ΨRACK site (purple (62)) are indicated. Intersection of green and red region is indicated in yellow. Lower panel shows the schematic of the domain with color-coded interaction regions. C. Interactions are mapped on the ιPKC catalytic domain (adapted from 1ZRZ (79)) crystallized with bis(indolyl)maleimide inhibitor (BIM1). Regions responsible for RACK binding (red (82)), nuclear localization sequence (purple (87)), phosphatidylglycerol binding (green (84)), PDZ interaction domain (black (85)), and V5/catalytic core interactions (light and dark blue (79)) are indicated. The front and back of the structure is shown for ease of visualization. Intersection of green and red region is indicated in yellow. Lower panel shows the schematic of the domain with color-coded interaction regions.
