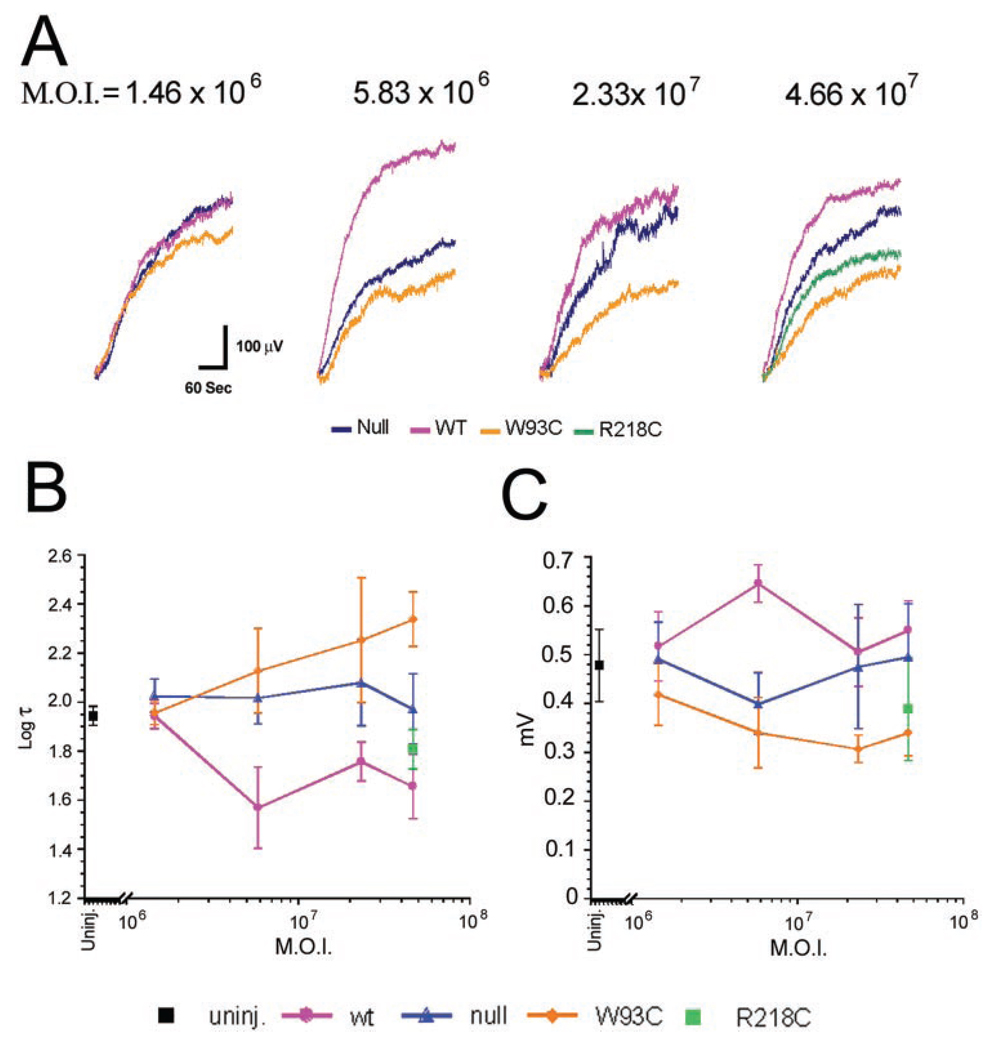
FIGURE 4.
Dose-response effects of bestrophin and bestrophin mutant overexpression on the LP. Mean LPs pinned at 110 sec into a 2.7-log cd/m2 stimulus are shown for each viral dose (A) and color coded as indicated. (B) Log τ data. LP amplitudes (C) in uninjected eyes and eyes overexpressing bestrophin, bestrophin mutants, or the control, were derived from the minimum and maximum values derived from each LP contributing to the grand averages shown in (A). Data in (B) and (C) are the mean ± SE, with 5 ≤ n ≤ 30. Color codes for (B) and (C) are as indicated.

