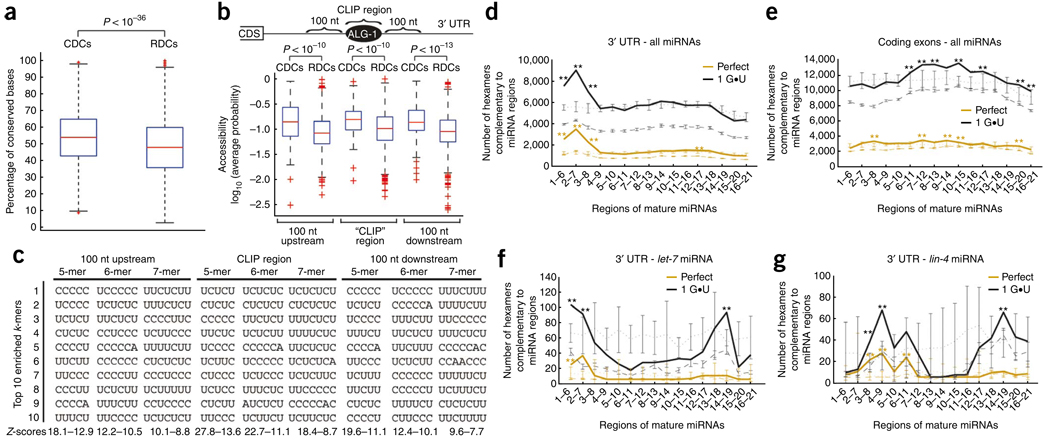
Figure 3.
Attributes enriched in ALG-1 binding sites within 3′ UTRs. (a) Box plots of the conservation levels measured as the fraction of perfectly conserved nucleotides between genome-wide alignments of C. elegans and HG004659 and GM084317 brenneri in CLIP-derived clusters (CDCs) and randomly derived clusters (RDCs). CDCs are significantly more conserved than RDCs as assessed by the Kolgomorov-Smirnov two-sample test (P < 10−36). (b) Box plots of RNA accessibility, measured as the average probability of being unpaired, of CDC and RDC and their corresponding flanking sequences (100 nt upstream or downstream). CDCs and flanking sequences are significantly more accessible than RDCs in the same locations as assessed by the Kolgomorov-Smirnov two-sample test (P < 10−10). (c) The ten most enriched k-mers (k = 5, 6, 7) within or 100 nt upstream or downstream of CDCs, compared to RDCs, are shown along with the range of Z-scores for the specific categories. (d–g). The number of conserved hexamers within CDCs (solid line) and RDCs (dashed line) that base-pair to miRNA or scrambled miRNA regions (dotted line), allowing for zero (orange) or only one G•U base pair (black). Error bars in dashed and dotted lines represent the s.d. among ten independent sets of RDCs and scrambled miRNAs, respectively. Hexamers within 3′-UTR CDCs and RDCs (d) or coding-exon CDCs and RDCs (e) that base-pair to cloned miRNAs or shuffled versions of cloned miRNAs. Hexamers within 3′-UTR CDCs and RDCs that base-pair to the let-7 or shuffled let-7 miRNA (f) and lin-4 or shuffled lin-4 miRNA (g). Regions of the miRNA(s) that have statistically enriched numbers of complementary hexamers within CDCs when compared to RDCs or shuffled miRNAs are denoted by * (P < 0.01) and ** (P < 10−6) as measured by a Z-test.

