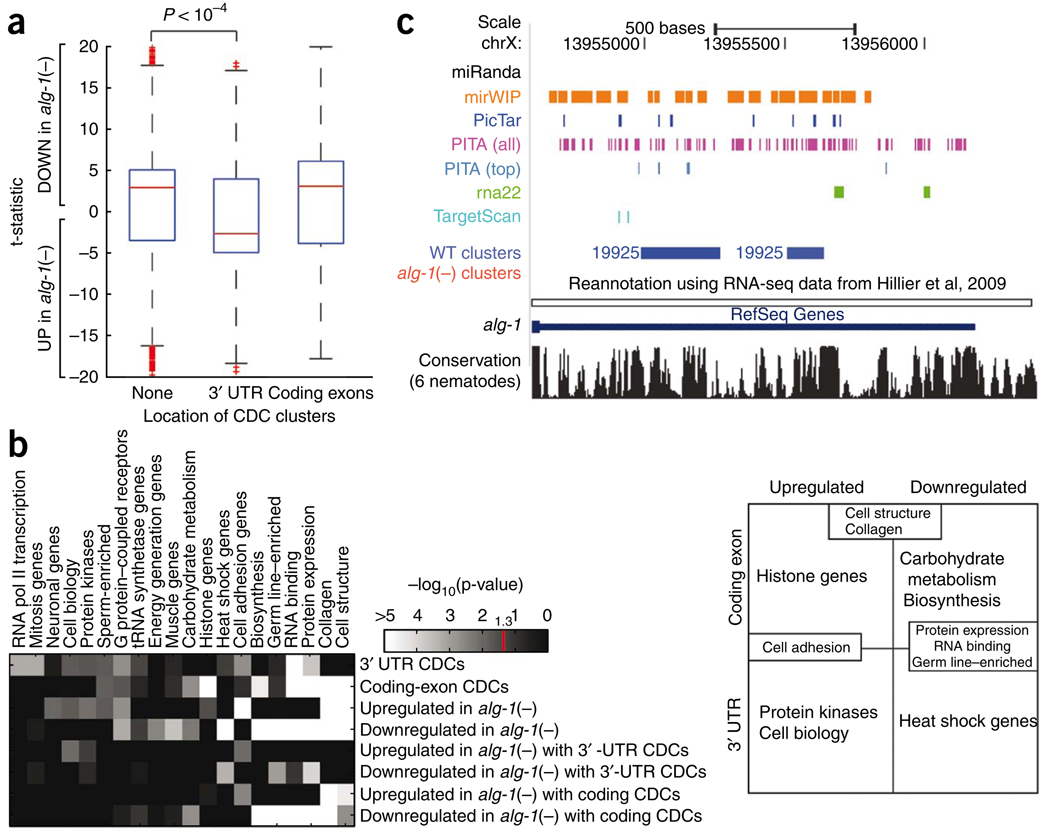
Figure 4.
Relationship between ALG-1 binding and mRNA expression levels. (a) Effects of ALG-1 binding on mRNA levels. Box plots representing the differential expression (as a t-statistic) of genes from biological replicate microarray experiments comparing alg-1(−) to WT L4-stage worms. Genes are divided into those that contained no CDCs and those that contained CDCs only within 3′ UTRs or coding exons. Compared to genes with no CDCs or coding-exon CDCs, genes with 3′-UTR CDCs are significantly more upregulated in alg-1(−) relative to WT as assayed by the Wilcoxon rank-sum test (P < 10−4). (b) Functional enrichment of genes that have CDCs only within 3′ UTR or coding exons that are up- or downregulated in alg-1(−) worms using significantly enriched (P < 0.05 in at least one row; Holm-Bonferroni corrected) functional categories defined by the C. elegans Topomap algorithm52. The intensity on the heat-map denotes −log10(p value). Genes represented by these functional categories can be divided in a matrix (right) depending on the location of the CDCs (3′ UTRs or coding exons), and whether the genes are up- or downregulated in the alg-1(−) mutants relative to WT worms. Several categories occupy multiple cells in the matrix, for example “Cell structure,” “Collagen,” “Cell adhesion,” “Protein expression,” “RNA binding” and “Germ line–enriched.” (c) UCSC Genome Browser view depicting clusters in the 3′ UTR of the alg-1 gene (blue, WT clusters; red, alg-1(−) clusters, none present) and the predicted miRNA binding sites by the various algorithms.

