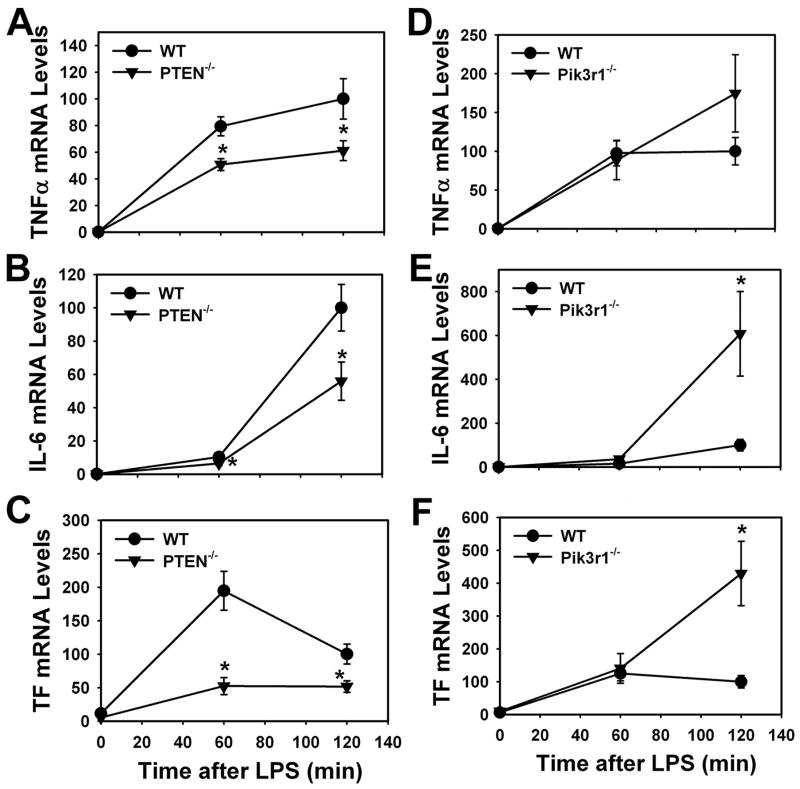
FIGURE 6.
LPS-induced expression of TNF-α, IL-6, and TF mRNA in WT and PTEN−/− PMs, and WT and Pik3r1−/− PECs. Levels of TNF-α (A), IL-6 (B), and TF (C) mRNA in WT and PTEN−/− PMs were determined 60 and 120 min after LPS stimulation. Levels of TNF-α (D), IL-6 (E), and TF (F) mRNA in WT and Pik3r1−/− PECs were determined 60 and 120 min after LPS stimulation. mRNA levels normalized to GAPDH are expressed as mean ± SEM (n = 5– 6) relative to WT cells stimulated with LPS for 120 min (defined as 100%).*, p <0.05.

