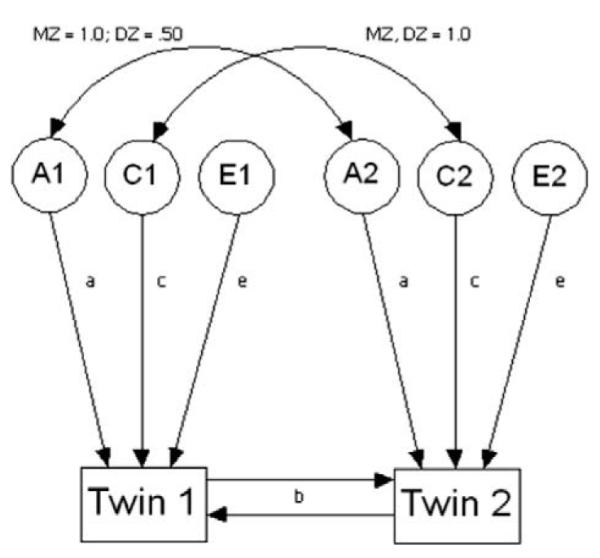
Fig. 1.

Sibling interaction model. Twins 1 and 2 are measured temperamental phenotypes for the two twins (e.g., shyness). A, C, E, are latent variables that represent additive genetic influence, shared environmental influence, and non-shared environmental influences, respectively. The curved two-headed arrows represent correlations between the variables they connect. The single-headed arrows a, c, e represents the additive genetic parameter, the shared environmental parameter, and the non-shared environmental parameter, respectively. The b interaction paths refer to the phenotypic interaction or contrast between each twin’s phenotype.
