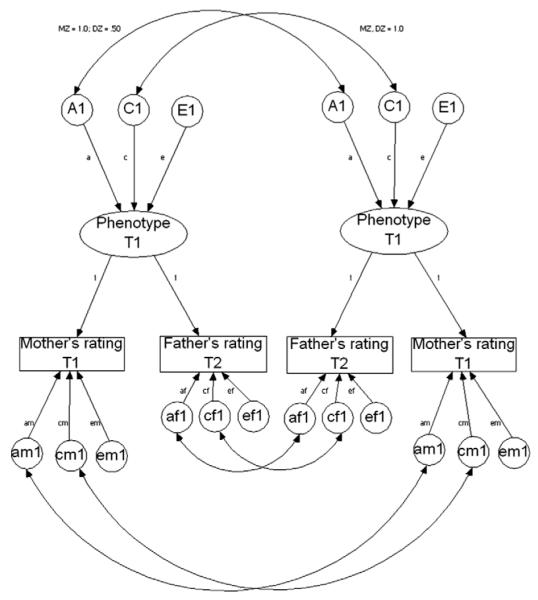
Fig. 3.
The psychometric model for child temperament based on mothers’ and fathers’ reports. Measured variables are represented by triangles and latent variables by circles. The upper part of the model (above the measured variables) contains a common factor of child temperament which captures the shared variance between mothers and fathers. A1, C1, and E1 (where 1 stands for twin 1) are the genetic and environmental estimates for this common factor. Double-headed paths represent the correlations between the additive genetic variance (MZ = 1.0; DZ = .50) and shared environmental variance (MZ/DZ = 1.0). The lower part of the model (below the measured variables) contains the effects on the variance that is unique to each rater: unique genetic variance (Am1 for mothers’ report), unique shared environment (Cm1), and unique non-shared environment (Em1). The paths representing the factor loadings for each of the informants on the common factor were fixed to one for model identification.

