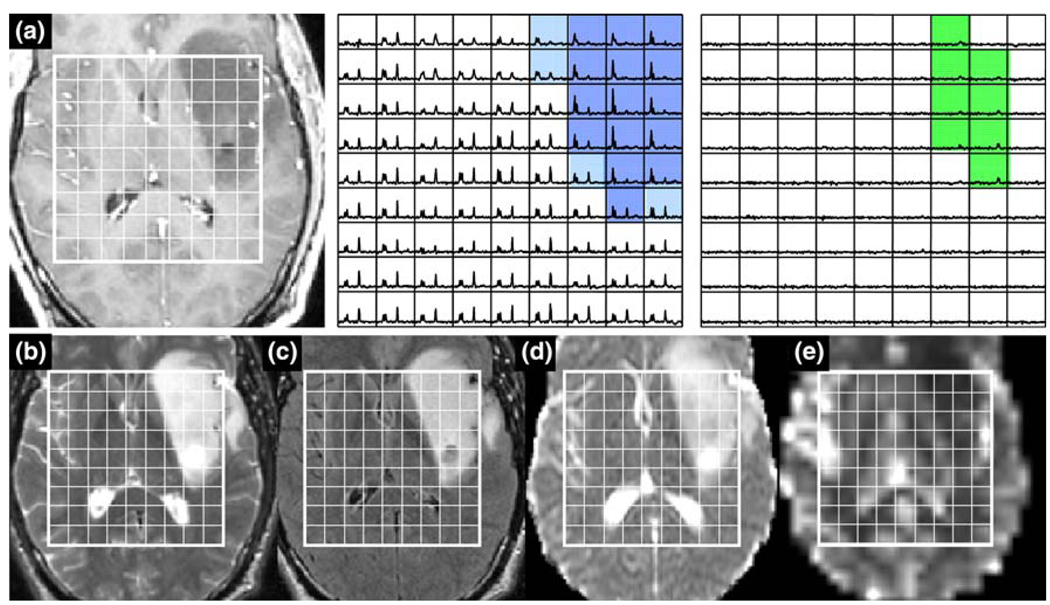
Fig. 7.
Patient with an OAIII: a is a post-Gadolinium T1-weighted image, b is a FSE image, c is a FLAIR image, d is an ADC map, and e is a map of nPH. The lactate edited spectra correspond to the sum (choline, creatine, NAA, and lipid if it is present) and the difference (which would show lactate if present). Light blue voxels show 2 < CNI <3 and dark blue voxels show CNI >3. Note the low nPH, lower nADC values and the voxels with visible but low lactate (green)

