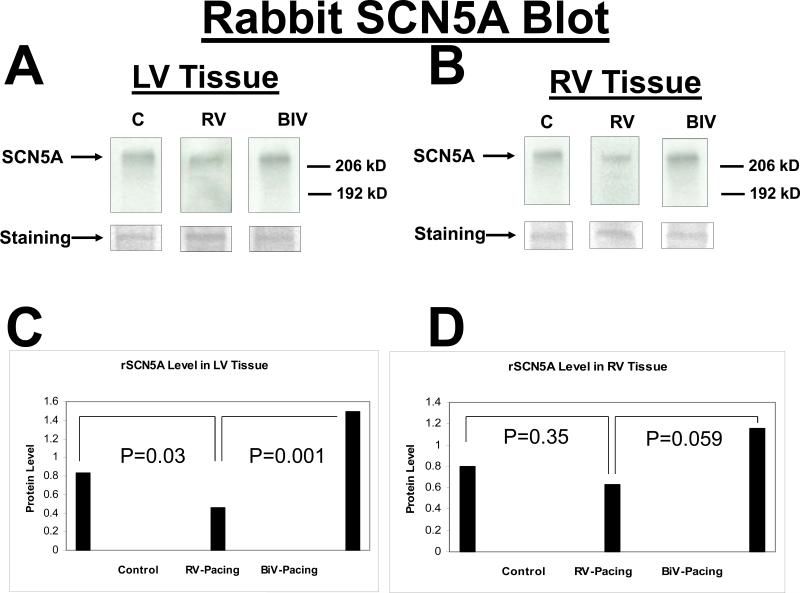
Figure 5.
SCN5A protein blot from the LV (A) and the RV (B) tissues for the 3 rabbit study groups (C, RV, and BIV). Panels C and D are the graphic representation of SCN5A protein levels from LV (C) and RV (D) tissues for the 3 study groups. Note the statistically significant increase in SCN5A levels in the BIV paced group compared to the RV paced and control groups and the lower SCN5A levels in the RV paced group compared to the C group in the LV but not RV extracted tissue.

