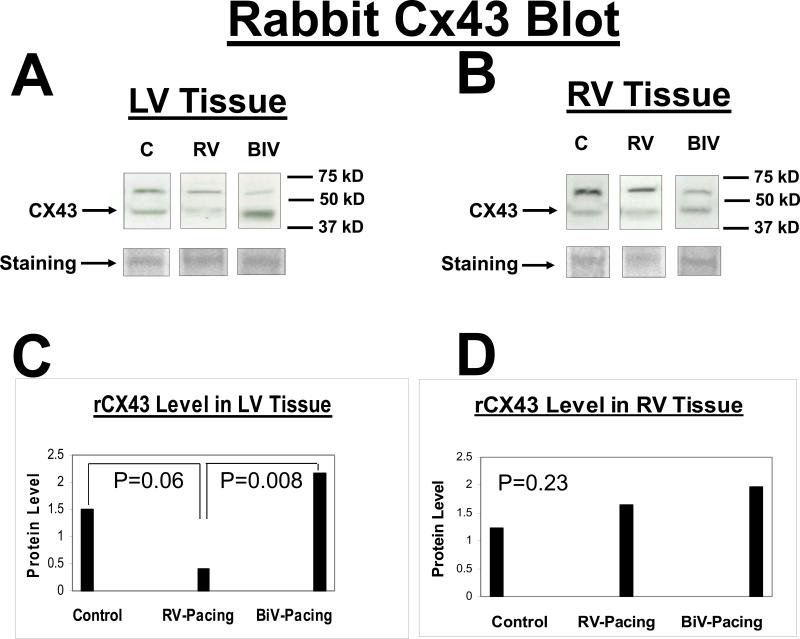
Figure 6.
Connexin43 protein blot from the LV (A) and the RV (B) tissues for the 3 rabbit study groups (C, RV, and BIV). Panels C and D are the graphic representation of Connexin43 protein levels from LV (C) and RV (D) tissues for the 3 study groups. Note the statistically significant increase in Connexin43 levels in the BIV paced group compared to the RV paced group in the LV but not RV extracted tissue.

