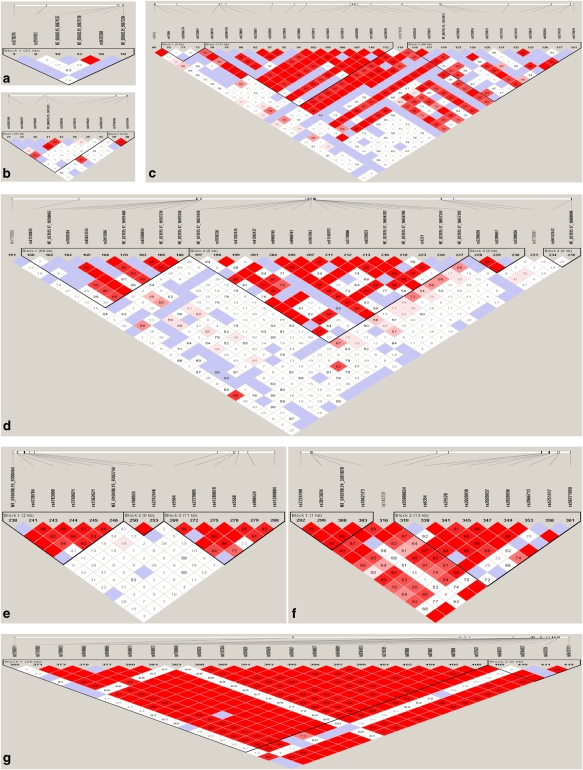
Figure 2.
Linkage disequilibrium (LD) pattern in seven genes: cyclic AMP-responsive element binding protein 1 (CREB1) (a), SLC6A3 (b), ATP-binding cassette subfamily B member 1 (ABCB1) (c), neurotrophic tyrosine kinase type 2 receptor (NTRK2) (d), SLC6A2 (e), SLC6A4 (f) and corticotropin-releasing hormone receptor 1 (CRHR1) (g). Standard color scheme in Haploview program is used to display the level of logarithm of odds (LODs) and the D′. Shown in each box are estimated statistics of the D′, which indicates the LD relationship between each pair of single nucleotide polymorphisms (SNPs) and are not labeled if D′=1.00. Regions are shown in bright red, light blue, shades of pink/red and white for D′=1+LOD⩾2, D′=1+LOD<2, D′<1+LOD⩾2 and D′<1+LOD<2, respectively. Vertical lines on the long horizontal white indicate the relative positions of SNPs in the gene.

