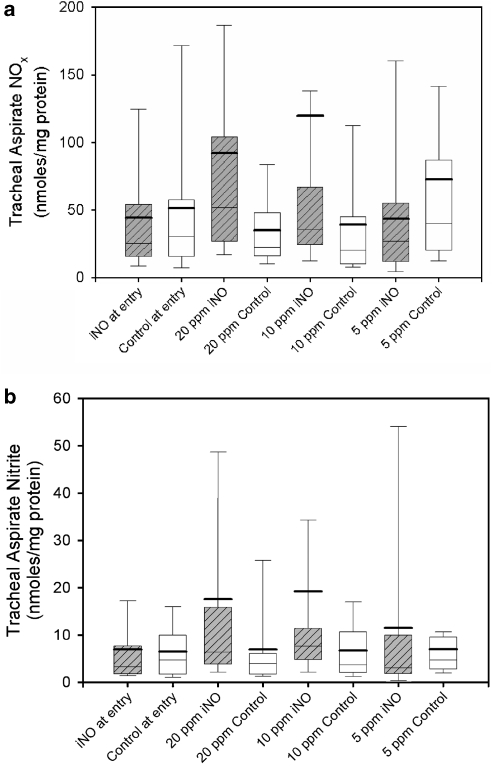
Figure 1.
Box and whisker plot of TA NOx (a) and TA nitrite (b) measurements in iNO-treated infants and control infants by dose of study gas. The box represents 25th and 75th percentile with a median bar. The whiskers represent the 10th and 90th percentiles and the heavy bar represents the mean of the samples. Statistical significance was shown at 20 and 10 p.p.m. between the iNO-treated and control infants for both NOx and nitrite. N=34 and 36 at study entry, 37 and 42 at 20 p.p.m., 30 and 30 at 10 p.p.m., 19 and 23 at 5 p.p.m. for treated and control infants, respectively. Only 11 samples for each group were available at 2 p.p.m. and median NOx values were 32.9 and 28.6 nmol mg–1 protein and nitrite values were 5.7 and 3.7 nmol mg–1 for treated and controls, respectively (not shown).

