Figure 2.
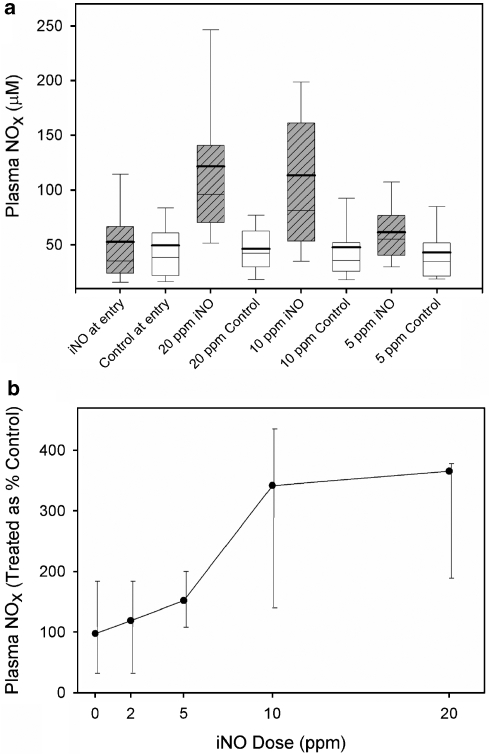
(a) Box and whisker plot of plasma NOx in iNO-treated and control infants by dose of study gas. NOx concentrations were significantly elevated in treated infants compared with control at 20, 10, and 5 p.p.m. N=48 and 47 at study entry, 46 and 44 at 20 p.p.m., 42 and 45 at 10 p.p.m., 33 and 35 at 5 p.p.m., and 18 and 22 at 2 p.p.m. for treated and control infants, respectively. (b) Plasma NOx concentrations in iNO-treated infants vs control infants by increasing dose of study gas. The median NOx value for treated infants at each dose of iNO as a percent of the median value of the relevant control infants is presented. NOx values did not change with dose of study gas in control infants. N values at each dose of iNO as noted in (a). Error bars represent the proportional 25th and 75th percentile values.

