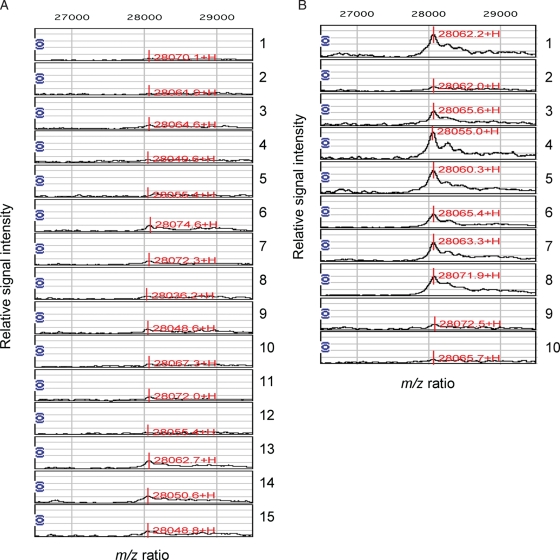
Figure 1.
Normalized SELDI-TOF-MS of mid-secretory endometrial biopsies from fertile women (A) and RIF patients (B) reveal a discriminatory 28 063 mass-to-charge (m/z) protein peak. Sample numbers are indicated on the right. The X-axis denotes the m/z values, whereas the Y-axis is a relative intensity scale. The mass spectra were obtained at pH 5.0 on Q10 chips, which capture positively charged proteins due to its negatively charged surface.

