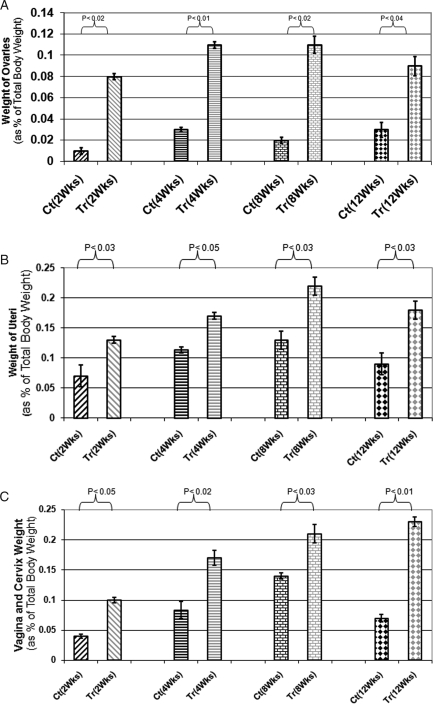
Figure 4.
(A) Ovaries weight of treated (Tr) versus control (Ct) animals. Weight considered as percentage of total body weight for each animal: as indicated weight of ovaries significantly increased at all time points of experiments (P < 0.02); (B) Uterus weight of treated (Tr) versus control (Ct) animals: weight considered as percentage of total body weight for each animal: uteri weight of treated animals increased at all time points of experiments up to 12 weeks (P < 0.04); (C) Vagina and Cervix weight of treated (Tr) versus control (Ct) animals: weight considered as percentage of total body weight for each animal. As indicated vagina and cervix weight increased in treated animals compared with control animals (P < 0.03).

