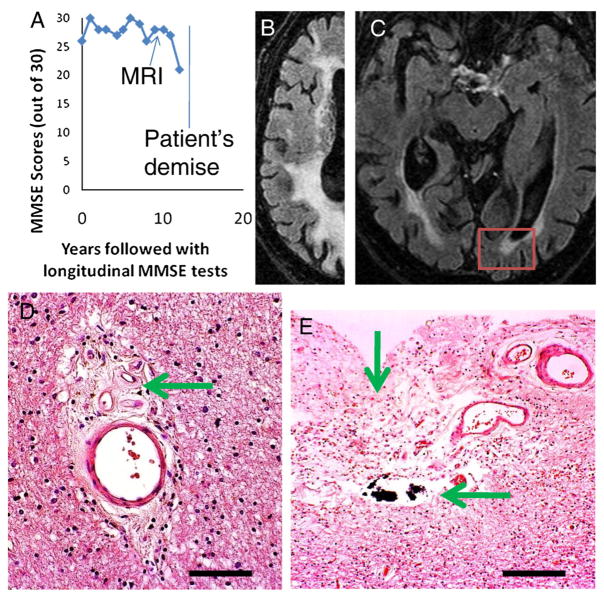
Fig. 4.
Diabetes Case 2–87-year old male with dementia and predominantly cerebrovascular disease by pathology. A shows a chart that depicts the MMSE scores by this patient. Note that the MRI was obtained prior to a significant decrease in the patient’s MMSE score (final score =21). B and C show MRI scans that show hydrocephalus ex vacuo and extensive pathological white matter enhancement. The red box in C shows the area depicted in photomicrographs D and E. D shows a small blood vessel in the white matter of visual cortex away from the ventricle. This vascular profile shows expansion of the Virchow–Robin space with organizing cellular material that includes new small blood vessels (arrow). E shows the area immediately subjacent to the ventricle with frank necrosis (vertical arrow) and calcification (horizontal arrow). Scale bars=150 μm in D and 300 μm in E.

