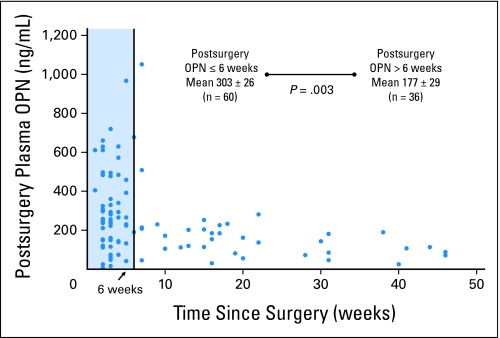
Fig 3.
Demonstration of the effect of time from resection on the postsurgery osteopontin (OPN); each blue dot represents the initial postsurgery OPN measurement plotted against time from surgery. There is significant variability of the marker before 6 weeks (blue box), which likely was due to the OPN role in wound healing. After 6 weeks, most levels were less than 200 ng/mL.

