
Figure 4.
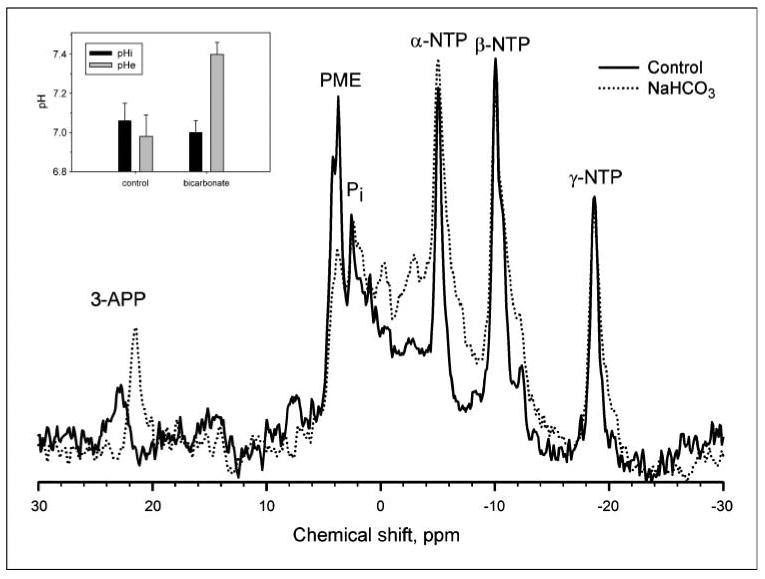
The effect of NaHCO3 treatment on tumor pH. All in vivo measurements were done at 4.7 T on a Bruker Biospec magnetic resonance imaging spectrometer equipped with a 14 G/cm self-shielded gradient insert, using volume excitation and home-built solenoid coils for reception. Image-guided volume-selective 31P magnetic resonance spectra of tumors in anesthetized mice were acquired as described in ref. 14. The pHe and pHi were measured from the chemical shifts of exogenous 3-aminopropylphosphonate and endogenous inorganic phosphate, respectively (17). For spectroscopy of tumors, 0.4 mL of 0.24 mol/L 3-aminopropylphosphonate was administered i.p. to mice a few minutes before anesthetization. Following anesthetization, a further 0.4 mL of 3-aminopropylphosphonate was injected i.p., and the mouse prepared for 31P MRS as before. This figure illustrates representative 31P magnetic resonance spectra from control (solid) and NaHCO3-treated (dotted) MDA-MB-231 tumor xenografts. 3-APP, 3-aminopropylphosphonate; Pi, endogenous inorganic phosphate; PME, phosphomonoesters; NTP, nucleoside triphosphate. Inset, columns, average values for tumor pHi (P = 0.89) and pHe (P = 0.01) in the absence and presence of bicarbonate treatment (n = 6 mice each); bars, SE. Details of the acquisition and processing parameters are provided in Materials and Methods.