
Figure 5.
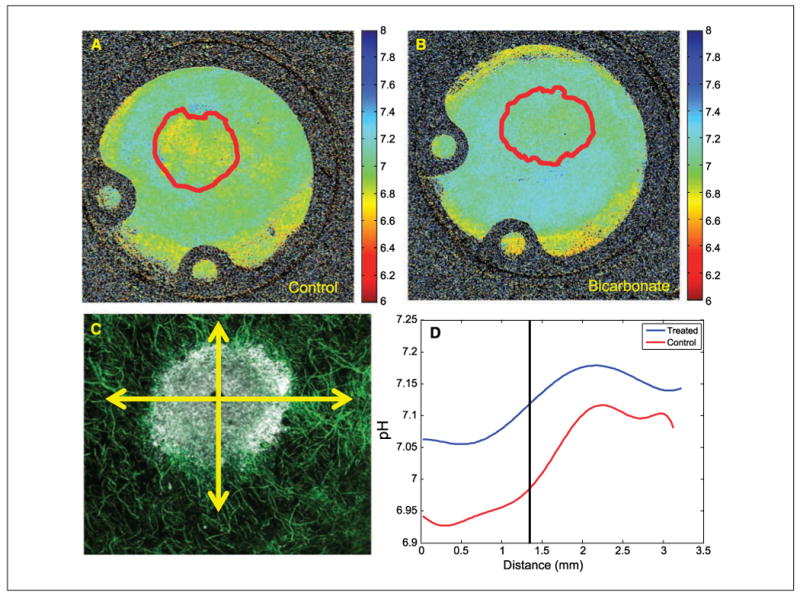
Microscopic pH gradients in window chambers. Tumors were inoculated into window chamber as described in Materials and Methods. pHe was measured following injection of SNARF-1 free acid by excitation with a He/Ne laser at 543 nm and emissions were collected in channel 1 with a 595/50-nm bandpass and in channel 2 with a 640-nm-long pass filter. Confocal images were converted to .tif format using ImageJ (http://rsb.info.nih.gov/ij/); respective background images were subtracted from each fluorescence image (red channel, blue channel); and image was then smoothed with a 2 × 2 kernel. The two images were then divided, subsequently removing zeros and not-a-numbers (NANs), creating a ratiometric image. The in vitro pH calibration was then applied to every pixel in the ratiometric image. Regions of interest were drawn around the tumor, the proximal peritumor region, and the distal “normal” region, and the mean pHe was calculated in these regions. The spatial pH distribution was calculated by drawing an intensity profile (5 pixels wide) from the center of the tumor out to the edge of the window chamber. These profiles were drawn in four orthogonal radial directions, originating from the tumor centroid. The pH profiles were then aligned so that they coincided at the tumor margin using the GFP image to determine the tumor rim. Representative pHe images are shown for untreated (A) and bicarbonate-treated (B) mice (10 × field of view, 12.5 mm). Red lines, region of interest of tumor, defined by GFP images, shown in Supplementary Fig. S2. C, merged confocal image of tumor (white) surrounded by a labeled microvascular network (green). Radial lines, directions along which pHe values were measured. D, least-square fit across all directions and all tumors showing pHe distributions along radial lines for control and bicarbonate-treated tumors. “0” is centroid of tumor, and vertical line indicates tumor edge.