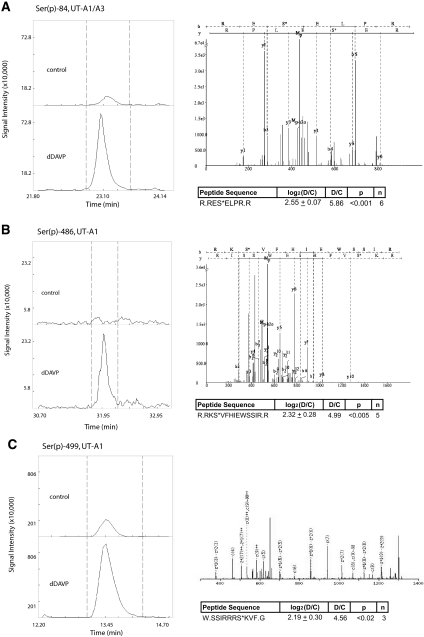
Figure 7.
MS quantification of UT-A phosphorylation is illustrated by reconstructed peptide ion chromatograms from QUOIL software. The data show an increase in peak areas with dDAVP treatment compared with control for (A) Ser(p)-84 on both UT-A1 and UT-A3, (B) Ser(p)-486 on UT-A1, and (C) Ser(p)-499 on UT-A1. Also shown in each subfigure are mean and SE values for all quantifications along with a representative MS2 spectrum for the identified peptide.

