Figure 3.
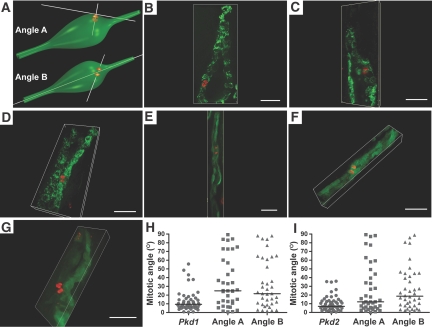
Mitotic orientation in early dilated tubular segments of Pkd1 and Pkd2 mouse models is shown. (A) Schematic representation showing angle A as the angle of the mitotic vector relative to the tangential plane of the dilated tubule wall and angle B as the angle of the mitotic vector relative to the tubule luminal vector. (B through D) Representative images of early dilated Pkd1flox/−;Ksp-Cre tubules at P3 stained with anti-H3pS10 (red) and anti–aquaporin 2 (green). (E through G) Representative images of Pkd2flox/flox;Pkhd1-Cre:RA/EG tubules at P8 through P10 stained with anti-H3pS10 (red) and EGFP (green). (B and F) Mitotic angles oriented within <30° of angle A and >30° of angle B. (C, D, and G) Mitotic angles at >30° for both angles A and B. (E) Mitotic angle <30° with respect to both angles A and B. Bars = 30 μm. (H) Aggregate data of angle A and angle B in Pkd1flox/−;Ksp-Cre (Pkd1; n = 35) compared with the respective nondilated Pkd1 mutant tubule data reproduced from Figure 1D. The distribution of angles A and B did not differ from each other but differed significantly from the mitotic angle distribution in nondilated tubules (P < 0.001). (I) Aggregate data of angle A and angle B in Pkd2flox/flox;Pkhd1-Cre:RA/EG mice (Pkd2; n = 38) compared with the respective nondilated Pkd2 mutant tubule data reproduced from Figure 1D. The distribution of angles A and B did not differ from each other but differed significantly from the mitotic angle distribution in nondilated tubules (angle A, P < 0.05; angle B, P < 0.01).

