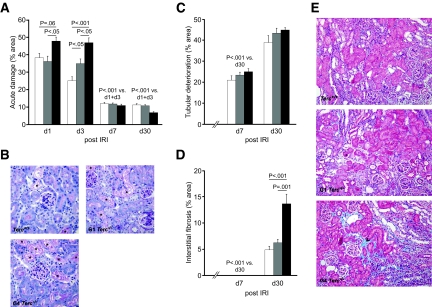
Figure 1.
Histopathology after renal IRI is shown. (A) Acute tubular damage, shown as percentage of damage to total tubular area, was quantified 1, 3, 7, and 30 d after 30 min of IRI of the left kidney in Terc+/+, G1 Terc−/−, and G4 Terc−/− kidneys. (B) Representative periodic acid-Schiff stainings 3 d after IRI showing more acute tubular damage in G4 Terc−/− compared with G1 Terc−/− and Terc+/+. * areas of acute tubular damage. (C) Chronic tubular deterioration and (D) interstitial fibrosis—both reflecting chronic kidney damage—were quantified 1, 3, 7, and 30 d after IRI in Terc+/+, G1 Terc−/−, and G4 Terc−/−. (E) Representative Masson Trichrome stainings showing increased interstitial fibrosis (blue staining, indicated by black arrowhead) in G4 Terc−/− on day 30 after IRI. □, Terc+/+;  , G1 Terc−/−; ■, G4 Terc−/−. Data are means ± SEM; significances are indicated. Magnification, ×200.

