
Figure 2.
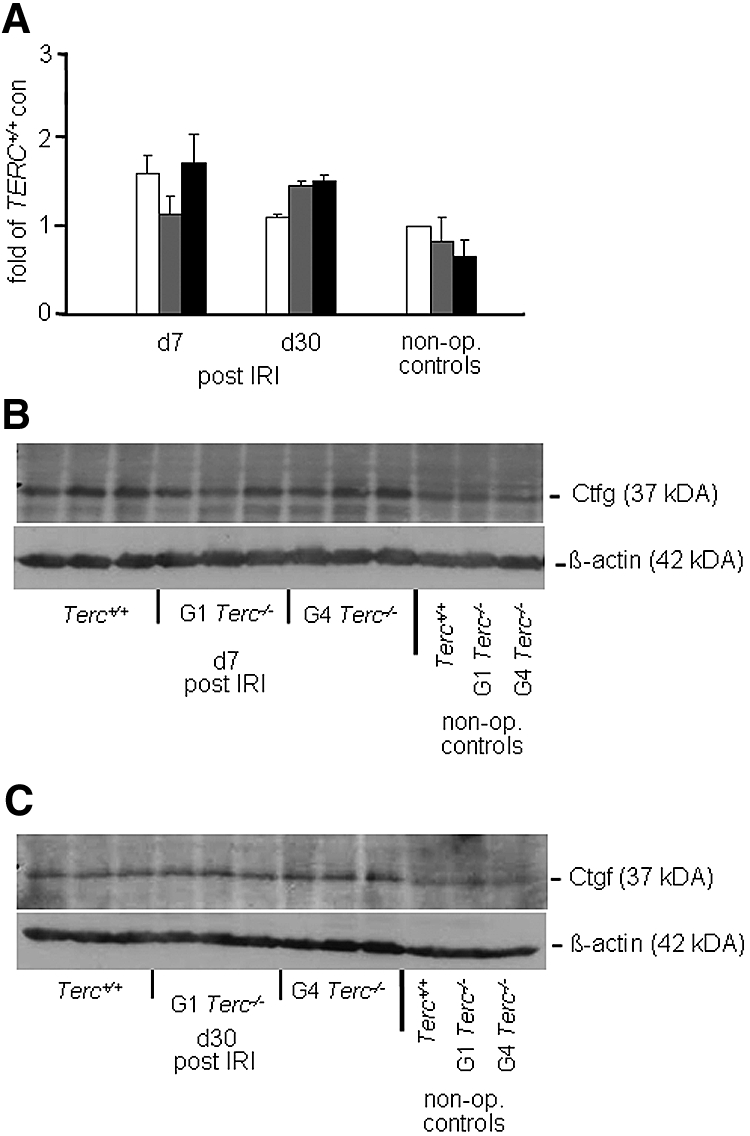
Renal Ctgf expression after IRI is shown. (A) Analysis of Ctgf protein expression given as fold expression on the basis of the expression of Terc+/+ nonoperated controls. (B and C) Western blots showing Ctgf at 37 kD and β-actin as a loading control at 42 kD for day 7 (B) and day 30 (C). □, Terc+/+;  , G1 Terc−/−; ■, G4 Terc−/−. Data are means ± SEM; significances are indicated.