Figure 4.
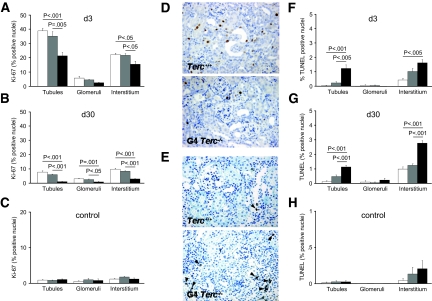
Proliferation and apoptosis after renal IRI are shown. (A through C) Quantification of Ki-67–positive tubular, glomerular, and interstitial nuclei in Terc+/+, G1 Terc−/−, and G4 Terc−/− animals 3 (A) and 30 d (B) after IRI and in sham-operated controls (C). Lower proliferation rates were seen in tubular and interstitial cells of G4 Terc−/− kidneys on day 3 and in tubular, glomerular, and interstitial cells of G4 Terc−/− kidneys on day 30 compared with Terc+/+ and G1 Terc−/−. Very low proliferation rates were detected in renal cells from sham-operated controls with no significant differences among the three groups. (D) Representative Ki-67 immunostainings on day 30 after IRI showing reduced numbers of positively stained nuclei in G4 Terc−/−. (E) Representative TUNEL stainings on day 30 after IRI showing increased numbers of apoptotic cells in G4 Terc−/−. TUNEL-positive cells are marked by arrowheads. (F through H) Quantification of TUNEL-positive tubular, glomerular, and interstitial nuclei in Terc+/+, G1 Terc−/−, and G4 Terc−/− animals 3 (F) and 30 d (G) after IRI and in sham-operated controls (H). For both time points after IRI, G4 Terc−/− kidneys showed a significantly higher number of TUNEL-positive tubular and interstitial cells compared with Terc+/+. The same was true for the comparison of G4 Terc−/− with G1 Terc−/− kidneys, with the exception of interstitial cells 3 d after IRI. Very low numbers of apoptotic tubular and interstitial cells and no apoptotic glomerular cells were detected in sham-operated controls, with no statistical differences between groups. □, Terc+/+;  , G1 Terc−/−; ■, G4 Terc−/−. Data are means ± SEM; significances are indicated. Magnification, ×200.

