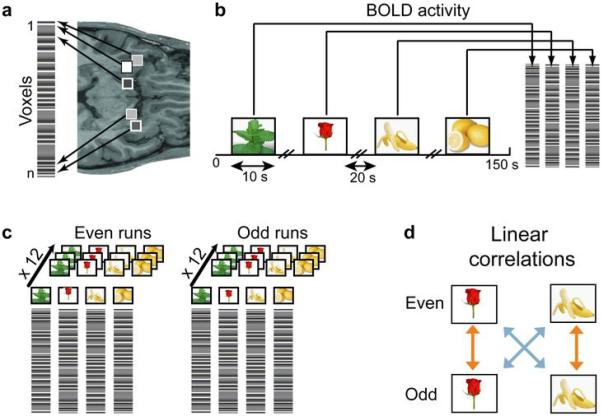
Fig. 1.
Schematic diagram of the correlation analysis. (a) The condition-specific spatial patterns of voxel activity in the PPC were transformed into linear vectors of voxel activity (pattern vectors). Voxels are represented by shaded squares on an axial slice of an anatomical MRI scan. The level of grey-scale intensity represents the blood oxygen level-dependent (BOLD) signal intensity. (b) Pattern vectors were composed of the peak BOLD activity across the stimulus presentation, shown here in the context of Experiment 1, for one run (150 s). (c) The entire dataset of pattern vectors was split into halves, one containing data from the 12 even runs and one from the 12 odd runs, and then averaged across runs, producing one mean pattern vector per odorant in each half of the data. (d) Averaged pattern vectors were used to calculate within-odorant (orange arrow) and across-odorant (blue arrow) pairwise correlation coefficients.

