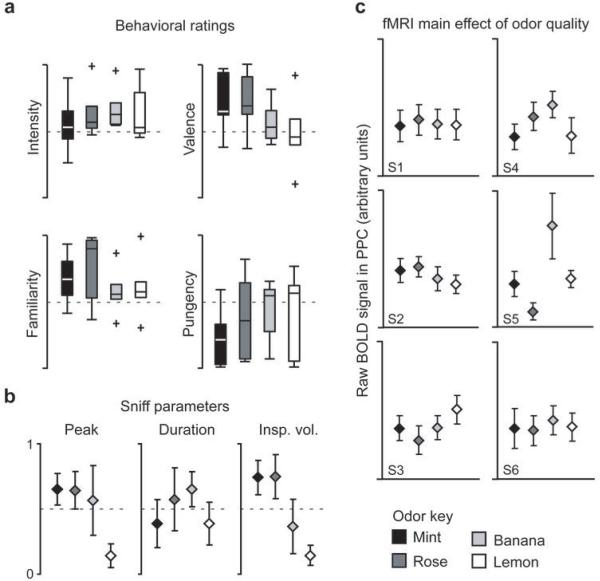
Fig. 2.
Behavioral data and univariate imaging analysis for Experiment 1. (a) Group-averaged behavioral ratings of odor intensity, pleasantness, pungency, and familiarity are depicted as boxplots indicating median (central line) and upper and lower quartiles (top and bottom of box, respectively) for each odorant. Whiskers denote extent of data between 10th and 90th percentiles. Outliers are indicated by crosses. Ratings did not significantly differ across any of these measures. (b) Mean normalized values (± between-subjects s.e.m.) for sniff peak amplitude, duration, and inspiratory volume (insp. vol.) did not significantly differ between the four odorants. (c) Plots of mean fMRI signal in PPC for each subject and odorant (± within-subject s.e.m.) revealed no significant difference except for subject 5 (S5).

