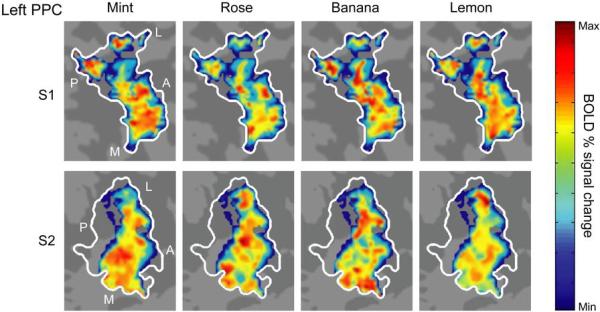
Fig. 4.
Odorant-specific spatial maps in PPC. The three-dimensional representations of odorant-evoked activity in PPC from two subjects were projected onto two-dimensional (flat) maps, allowing visualization of voxel-wise odor patterns within a single plane. Maps depict the odorant-evoked BOLD percent signal change in all odor-active voxels (liberally thresholded at P < 0.5), averaged across trials for each of the four odorants. The pseudocolor scale spans the full range of BOLD percent signal change within each map, from minimum (deep blue) to maximum (bright red). Each odorant elicited a distributed pattern of fMRI activity within left PPC (white outline) that overlapped with, but was distinct from, the other odorants. Unique distributed, overlapping profiles were also observed in right PPC (not shown). A, anterior; L, lateral; M; medial; P, posterior.

