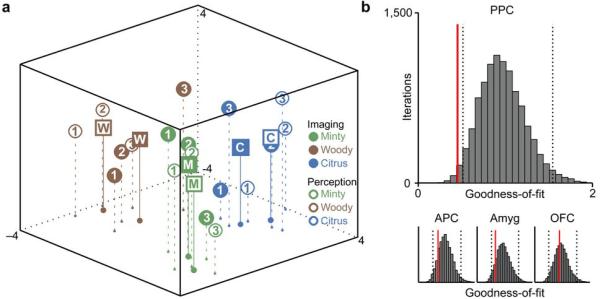
Fig. 7.
Alignment of fMRI spatial patterns and perceived odor quality. (a) The group-averaged imaging and perceptual data-sets were each projected onto a common three-dimensional space using multidimensional scaling (MDS), revealing that the imaging maps of PPC linear correlations (filled circles) closely overlapped with the perceptual maps of odor quality similarity (empty circles), both for individual odorants and for odor quality categories. Squares labelled “M” (minty), “W” (woody), and “C” (citrus) represent centroids of each category for the imaging (solid squares) and perceptual (empty squares) data. (b) The observed goodness-of-fit in PPC (red line) fell outside the lower bound of the 95% confidence interval (dashed lines) of a randomly permuted distribution of goodness-of-fits, demonstrating a significant alignment between PPC activity and perception in this region. Alignment between imaging and perception was not significant in APC, amygdala, or OFC.

