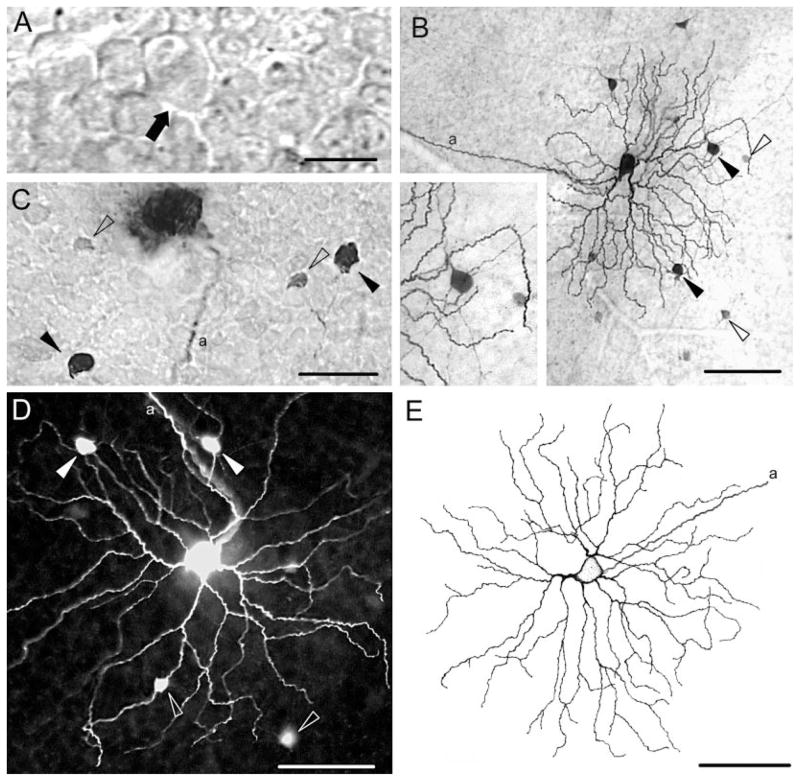
Fig. 1.
Morphology and tracer coupling pattern of ON alpha cells in the wild-type mouse retina. A: Digital video showing the vitreal surface of a live mouse retina-eyecup preparation illuminated with transscleral infrared light. Outlines of somata in the ganglion cell layer are clearly visible. Arrow points to largest soma in the field, which was impaled with an intracellular electrode and injected with Neurobiotin. B: Neurobiotin-labeled ON alpha cells visualized with DAB histochemistry showing the basic dendritic architecture and tracer coupling patterns. Filled arrowheads indicate tracer-coupled amacrine cells with intensive Neurobiotin label and relatively large somata. Open arrowheads indicate tracer-coupled amacrine cells with lightly labeled, small somata. Inset shows an enlargement of the upper right corner of B detailing the morphology of large and small tracer-coupled amacrine cells. C: Tracer coupling pattern of an injected ON alpha cell in which lightly labeled amacrine cell somata (open arrowhead) are located more proximal to the ganglion cell body than the darkly labeled amacrine cells (black arrowheads). Conventions the same as in B. D: Tracer coupling pattern of an ON alpha cell injected with Neurobiotin and visualized with fluorescent (Cy3-conjugated streptavidine) histochemistry is similar to that seen with DAB histochemistry. Conventions the same as in B. E: Camera lucida drawing of an ON alpha ganglion cell. a, axonal process. Scale bar = 20 μm in A; 75 μm in B (40 μm for inset); 40 μm in C; 50 μm in D,E.

