
Fig. 7.
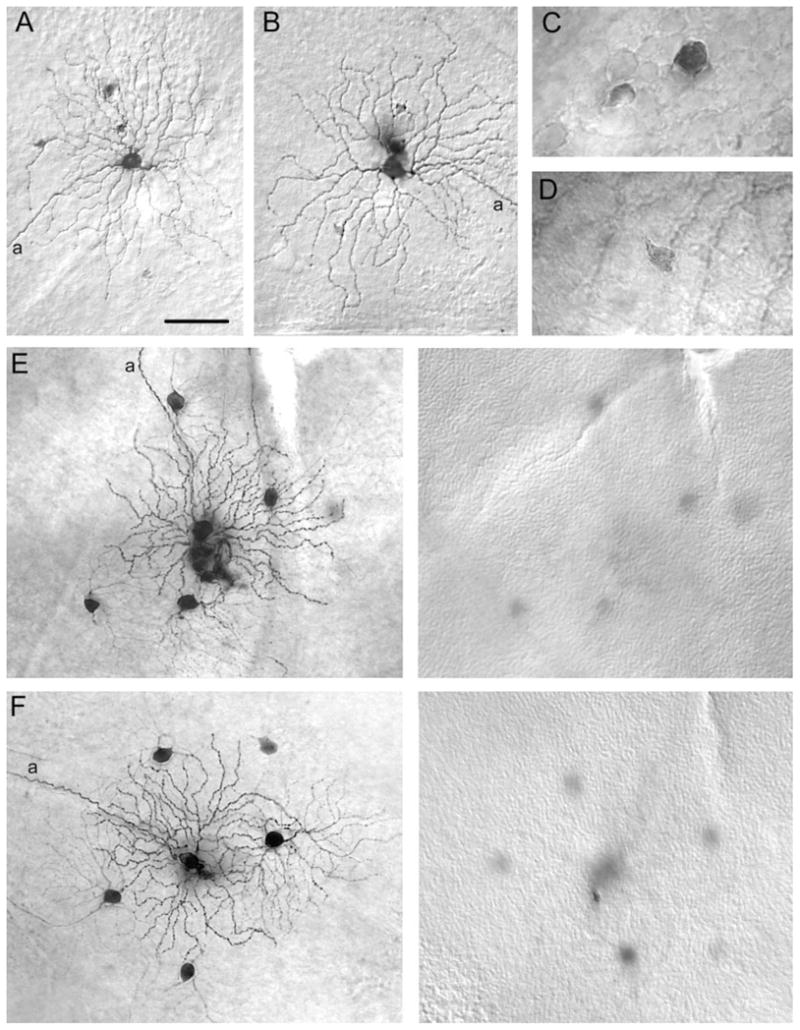
Tracer-coupling pattern of changes in Neurobiotin-injected alpha cells in the Cx36 KO animals. A,B: Photomicrographs showing that ON alpha cells in the Cx36 KO retina have heterologous tracer coupling to only a few amacrine cells with small, lightly labeled somata. C: High-magnification micrograph showing the somata of the two subtypes of amacrine cell tracer coupled to ON alpha cells in the wild-type retina. D: High magnification of soma of an amacrine cell tracer coupled to an ON alpha cell in the Cx36 KO retina. The size, shape, and labeling intensity of this cell is very similar to that of the lightly labeled amacrine cell in C. E,F: Photomicrographs of pairs of Neurobiotin-injected OFF alpha cells. Left panels show arbors of injected and tracer-coupled alpha cells with somata overlaid for clarity. Right panels illustrate plane of focus on the amacrine cell layer in the proximal edge of the INL. Whereas homologous coupling of OFF alpha cells is evident in the Cx36 KO retina, all coupling to amacrine cells is eliminated. a, axonal process. Scale bar = 75 μm in A (applies to A,B,E,F); 20 μm for C,D.