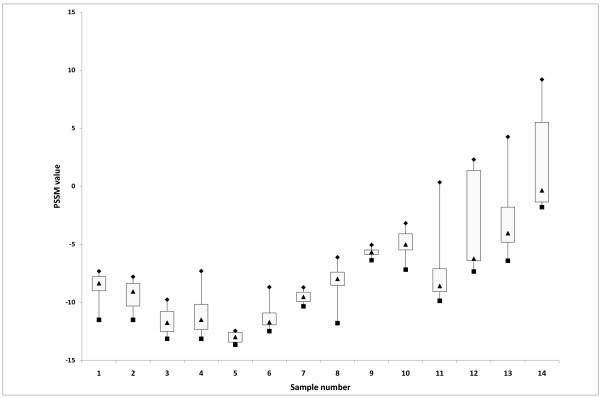
Figure 2.
Overview of the distribution of PSSM scores of the V3 haplotypes on 14 clinical isolates failing the gp160 phenotyping assay. Boxplot symbols are as in Figure 1. Data (min, q1, median, q3, max) for this figure are given in Additional file 1: Overview Results.

