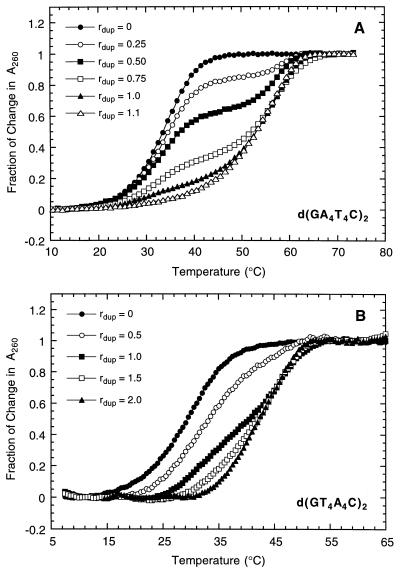
Figure 2.
UV melting profiles at 260 nm for the d(GA4T4C)2 duplex (A) and the d(GT4A4C)2 duplex (B) and their 5PTB complexes at the indicated values of [total ligand]/[duplex], rDup. For clarity of presentation, the melting curves for a given duplex and its 5PTB complexes are normalized by subtraction of both upper and lower baselines.

