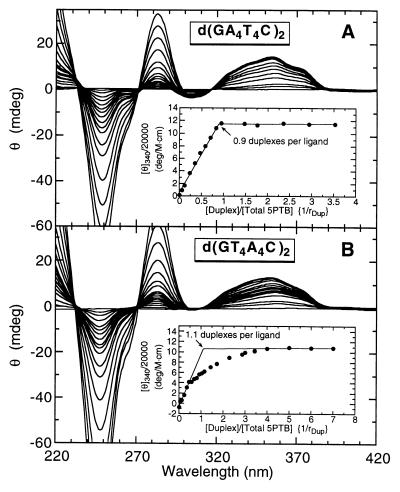
Figure 3.
CD titrations at 20°C of 5PTB with either d(GA4T4C)2 (A) or d(GT4A4C)2 (B). From bottom to top at 350 nm, the CD spectra in A correspond to 1/rDup ratios ranging from 0 to 3.5, while the CD spectra in B correspond to 1/rDup ratios ranging from 0 to 7.0. (Insets) Normalized molar (mol of total 5PTB/liter) ellipticities at 340 nm vs. 1/rDup for titration. The apparent binding stoichiometries are indicated and correspond to the apparent inflection points.

